Physics • Year 12 • Module 5 • Lesson 1
Projectile Motion Fundamentals
Apply your understanding of component equations, independence of motion and kinematic analysis to real data, data tables and diagram-based scenarios.
1. Interpret experimental data — comparing projectile launches
A student launches the same ball at different angles and speeds from ground level. The table records the horizontal and vertical components of the launch velocity along with the measured time of flight and horizontal range. 8 marks
| Trial | vx (m/s) | vy (m/s) | Time of flight (s) | Range (m) |
|---|---|---|---|---|
| 1 | 15.0 | 9.8 | ||
| 2 | 12.0 | 14.7 | ||
| 3 | 8.0 | 19.6 | ||
| 4 | 20.0 | 4.9 |
1.1 Complete the “Time of flight” and “Range” columns. Use g = 9.8 m/s². Show your working for Trial 1 below. 4 marks (1 per trial time, range derived from time)
1.2 Identify which trial has the greatest range and explain, using the data, why a larger vy does not necessarily produce a greater range. 2 marks
1.3 State which variable in the table is controlled and unchanged by horizontal motion, and explain what this demonstrates about projectile motion. 2 marks
2. Interpret graph — vertical velocity versus time during projectile flight
A ball is launched at 25 m/s, 40° above the horizontal. The graph below shows the vertical component of velocity (vy) versus time for the flight. 7 marks
Figure 2. Vertical velocity component (vy) versus time for a ball launched at 25 m/s, 40° above horizontal. g = 9.8 m/s². Illustrative data.
2.1 Describe the relationship between vy and time shown in the graph. What does the slope of this line represent? 2 marks
2.2 Using the graph, estimate the time at which the projectile reaches maximum height and explain how you can identify this from the graph. 2 marks
2.3 A student claims: “The negative values of vy after the peak mean the ball is moving backwards.” Identify the error in this reasoning and provide a correct explanation. 3 marks
3. Compare horizontal and vertical motion during projectile flight
Complete the two-column table below. For each feature, write a concise description that contrasts horizontal and vertical motion. 10 marks (1 per cell)
| Feature | Horizontal motion | Vertical motion |
|---|---|---|
| Acceleration | ||
| Velocity during flight | ||
| Kinematic equation for displacement | ||
| Role in determining time of flight | ||
| Australian sport example |
4. Predict and justify — a cricket ball scenario
During a cricket match at the MCG in Melbourne, a batsman hits a ball at 28 m/s at 35° above the horizontal from ground level. A fielder is standing 55 m from the batsman in the direction the ball is hit.
5 marks
4.1 Without performing a full calculation, predict whether the ball will reach the fielder at or above head height (approximately 2 m). Justify your prediction by identifying which component of velocity and which kinematic quantity you would need to determine this. 3 marks
4.2 The batsman then plays a shot at the same speed (28 m/s) but at a shallower angle of 20°. Predict how the range and maximum height will change compared with the 35° shot, and justify your prediction using the component equations. 2 marks
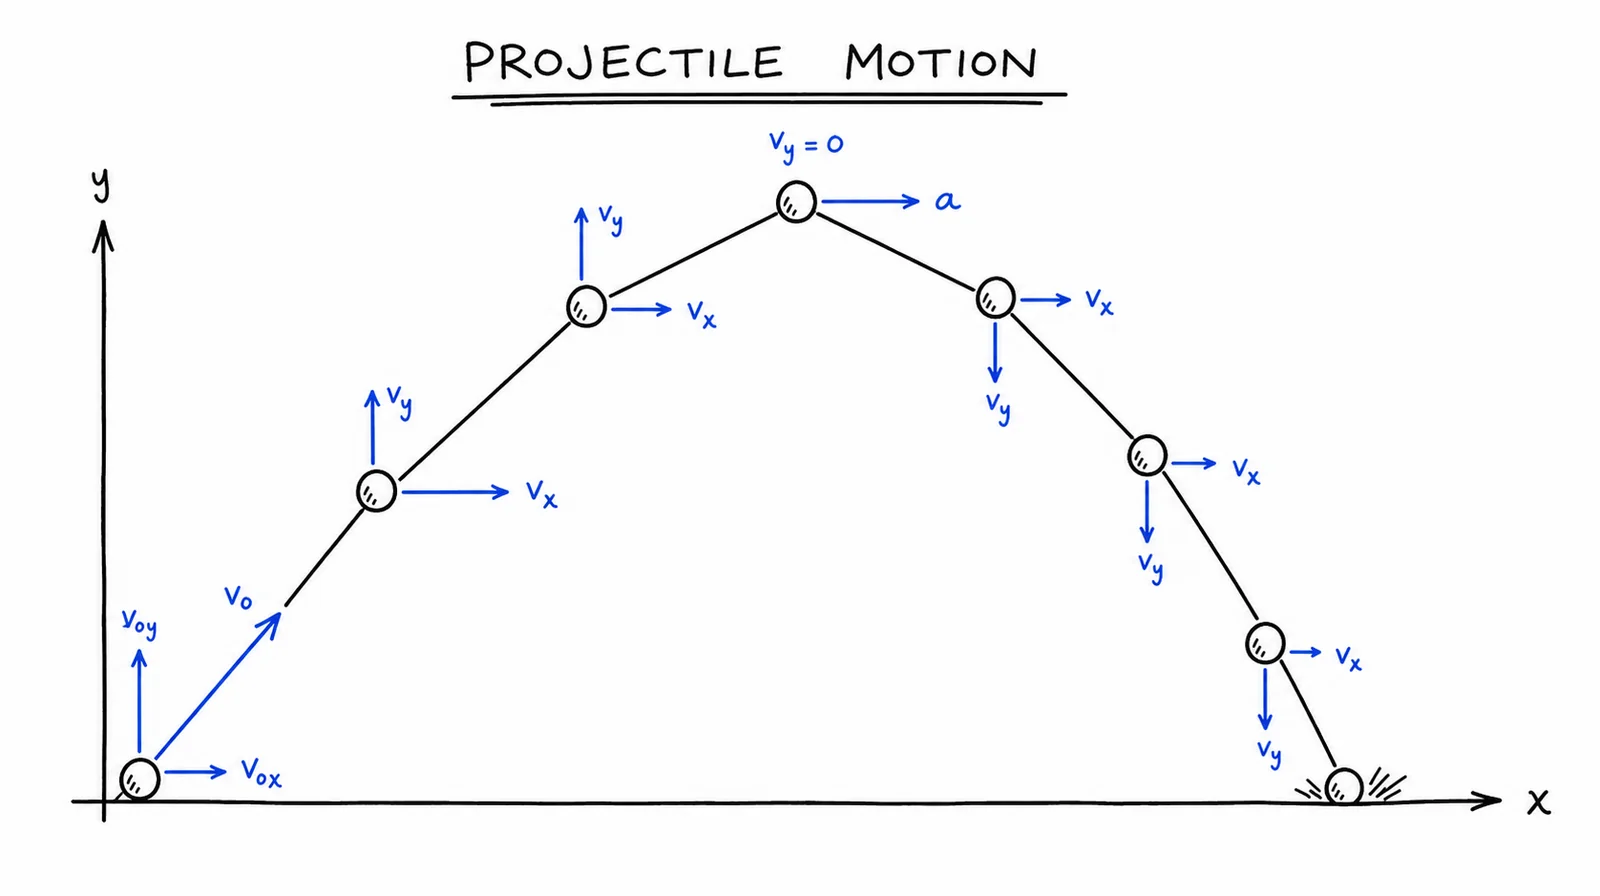
5. Diagram critique — what’s wrong with this student’s projectile diagram?
A Year 12 student drew a diagram to describe projectile motion. There are three errors in the diagram. Identify each error and write the correction. 6 marks (2 per error: 1 identify, 1 correct)
5.1 Error 1: What is wrong?
Correction:
5.2 Error 2: What is wrong?
Correction:
5.3 Error 3: What is wrong?
Correction:
Q1.1 — Data table (completed)
Working for Trial 1: t = 2vy/g = 2 × 9.8/9.8 = 2.0 s; Range = vx × t = 15.0 × 2.0 = 30.0 m.
Trial 1: t = 2.0 s, Range = 30.0 m. Trial 2: t = 2 × 14.7/9.8 = 3.0 s, Range = 12.0 × 3.0 = 36.0 m. Trial 3: t = 2 × 19.6/9.8 = 4.0 s, Range = 8.0 × 4.0 = 32.0 m. Trial 4: t = 2 × 4.9/9.8 = 1.0 s, Range = 20.0 × 1.0 = 20.0 m.
Q1.2 — Greatest range
Trial 2 has the greatest range (36.0 m). A larger vy alone does not guarantee greater range because range depends on both vx and time of flight. In Trial 3, vy is the largest, giving the longest flight time (4.0 s), but vx is only 8.0 m/s, so the range (32.0 m) is less than Trial 2. Range is maximised when the product vx × (2vy/g) is greatest.
Q1.3 — Controlled variable
The time of flight in each trial depends only on vy (not vx). This demonstrates the independence of horizontal and vertical motions: changing vx does not alter the time of flight, which is controlled entirely by the vertical component.
Q2.1 — vy vs time trend and slope
The vertical velocity decreases linearly from +16.1 m/s at t = 0 to −16.1 m/s at t = 3.28 s. The slope of this line is constant at −9.8 m/s², which represents the gravitational acceleration (g downward).
Q2.2 — Time at maximum height
Maximum height is reached at t ≈ 1.64 s. On the graph this is the point where the line crosses the x-axis (vy = 0). At maximum height, the vertical velocity is zero because the ball has been decelerated to a stop vertically before gravity begins accelerating it downward again.
Q2.3 — Error in student claim
Error: The student confused the sign convention for velocity with the direction of horizontal travel. Negative vy does not mean the ball moves backwards horizontally — it means the ball is moving downward vertically [1]. The sign convention used here is “upward positive”; after the peak, gravity has reversed the vertical direction of travel (the ball is now falling) [1]. The horizontal velocity vx remains positive and constant throughout; the ball continues to travel forward horizontally at all times [1].
Q3 — Compare and contrast table
Acceleration: Horizontal: zero (ax = 0, no horizontal force). Vertical: constant −9.8 m/s² (gravity, downward). Velocity during flight: Horizontal: constant (vx unchanged throughout). Vertical: changes continuously (decreasing upward, becoming zero at peak, then increasing downward). Displacement equation: Horizontal: sx = vxt (constant velocity). Vertical: sy = uyt − ½gt² (uniformly accelerated). Role in flight time: Horizontal: does not determine flight time. Vertical: entirely determines flight time (via vy = uy − gt and sy at landing). Australian sport example: Horizontal: AFL drop punt — the forward travel covers the ground distance to the target. Vertical: the kick height determines how long the ball is airborne; a higher kick gives more time for players to run under it.
Q4.1 — Cricket ball prediction
vx = 28 cos 35° = 22.9 m/s; vy = 28 sin 35° = 16.1 m/s. Time to reach fielder at 55 m: t = 55/22.9 = 2.40 s. Vertical position: sy = 16.1(2.40) − 4.9(2.40)² = 38.6 − 28.2 = 10.4 m. The ball passes well above head height at 55 m — it would need to be caught by a player jumping well above 2 m, or the fielder is beyond the optimal catch position. The key quantities are time to cross 55 m (from vx) and the vertical displacement at that time (from vy and g).
Q4.2 — Effect of shallower angle
At 20°: vx = 28 cos 20° = 26.3 m/s (greater); vy = 28 sin 20° = 9.6 m/s (smaller). Since vy is smaller, the maximum height and flight time will both decrease. Since vx is larger but flight time is shorter, the range may be less than at 35° (35° is closer to 45°, the optimal angle, so it typically has a greater range at the same speed). The maximum height is lower because uy is smaller.
Q5 — Diagram critique (6 marks)
5.1 Error 1 (horizontal velocity vectors shrinking): The diagram shows horizontal velocity vectors getting progressively shorter along the trajectory, implying the ball slows horizontally as it rises [1]. Correction: The horizontal velocity is constant throughout the entire flight (ax = 0). All horizontal velocity vectors should be the same length [1].
5.2 Error 2 (acceleration vector sideways at peak): The diagram shows the acceleration vector pointing sideways (horizontally) at the peak rather than downward [1]. Correction: Gravitational acceleration always acts vertically downward at 9.8 m/s² at every point in the trajectory, including at the peak. The acceleration vector should always point straight downward [1].
5.3 Error 3 (triangular trajectory): The trajectory is drawn as a straight-sided triangle rather than a smooth parabolic curve [1]. Correction: A projectile trajectory is a parabola. The path is a smooth curve that is steeper near launch and landing, and symmetrical about the peak when launch and landing heights are equal [1].