Physics • Year 11 • Module 2 • Lesson 7
Gravitational PE and Energy Conservation
Apply the conservation of mechanical energy to real data, graphs and scenarios; calculate speeds, energies and friction losses in context.
1. Interpret experimental data — Snowy Hydro energy audit
Engineers at the Snowy Mountains Scheme measured the energy of water as it fell through a penstock (pipe) from the upper reservoir to the turbine hall. The table below records measurements at four heights above the turbine (reference level h = 0). The water mass flow was 1000 kg per second. 8 marks
| Height above turbine (m) | Speed of water (m/s) | Gravitational PE (J) | Kinetic energy (J) | Total Emech (J) |
|---|---|---|---|---|
| 300 | 0 (at rest) | 0 | ||
| 200 | ||||
| 100 | ||||
| 0 (turbine level) | 0 |
Use g = 9.8 m s−2. Assume frictionless penstock for parts (a)–(c).
1.1 Complete the table by calculating PE, KE, speed, and total Emech at each height. 4 marks (0.5 per cell, 8 cells)
1.2 Describe what happens to the distribution of kinetic and potential energy as the water descends. Does total mechanical energy change? 2 marks
1.3 In reality the water arrives at the turbine at only 72 m/s, not the ideal speed. Calculate the actual kinetic energy and the energy lost to friction and pipe resistance over the 300 m descent. 2 marks
2. Interpret graph — rollercoaster energy profile
The graph below shows how the kinetic energy (KE) and gravitational potential energy (GPE) of a 400 kg rollercoaster car vary with position along a frictionless track. The car starts from rest at position A. 7 marks
Figure 2. GPE (solid blue) and KE (dashed red) for a 400 kg rollercoaster car on a frictionless track. Total mechanical energy = 120 kJ. Positions A–E along the track.
2.1 At which position does the car have the greatest speed? Justify using the graph. 2 marks
2.2 Read the KE at position D from the graph (approximately 60 kJ). Calculate the speed of the car at D. Show your working. 2 marks
2.3 A student claims that the dashed horizontal line on the graph proves “energy is created as the car falls.” Identify the flaw in this reasoning and explain what the constant total energy actually demonstrates. 3 marks
3. Compare frictionless and real rollercoaster tracks across five features
Complete the two-column table. For each feature, describe how it applies to each track type. 10 marks (1 per cell)
| Feature | Frictionless track | Real track (friction present) |
|---|---|---|
| Formula to use | ||
| Total mechanical energy | ||
| Speed at the bottom | ||
| Energy not recovered as motion | ||
| Effect of doubling mass |
4. Predict and justify — the Snowy 2.0 pumped-hydro scenario
Snowy 2.0 will pump water up from the lower reservoir to the upper reservoir (360 m elevation gain) during periods of excess electricity, then release it downhill to generate electricity during peak demand. Assume the pump is 100% efficient (no friction losses in this question).
5 marks
4.1 Calculate the gravitational PE stored when 1.0 × 10⁶ kg of water is lifted 360 m. Show your working. 2 marks
4.2 When this water is released (starting from rest), predict its speed at the turbine (360 m below). Show the algebraic cancellation of mass. 2 marks
4.3 In reality, the water arrives at the turbine with less KE than predicted. Name one physical reason for this and state the form into which the missing energy has been converted. 1 mark
5. Diagram critique — what is wrong with this energy diagram?
A Year 11 student drew the energy bar diagrams below for a ball rolling down a frictionless ramp. There are three physics errors in the diagram. Identify each error and write the correction. 6 marks (2 per error)
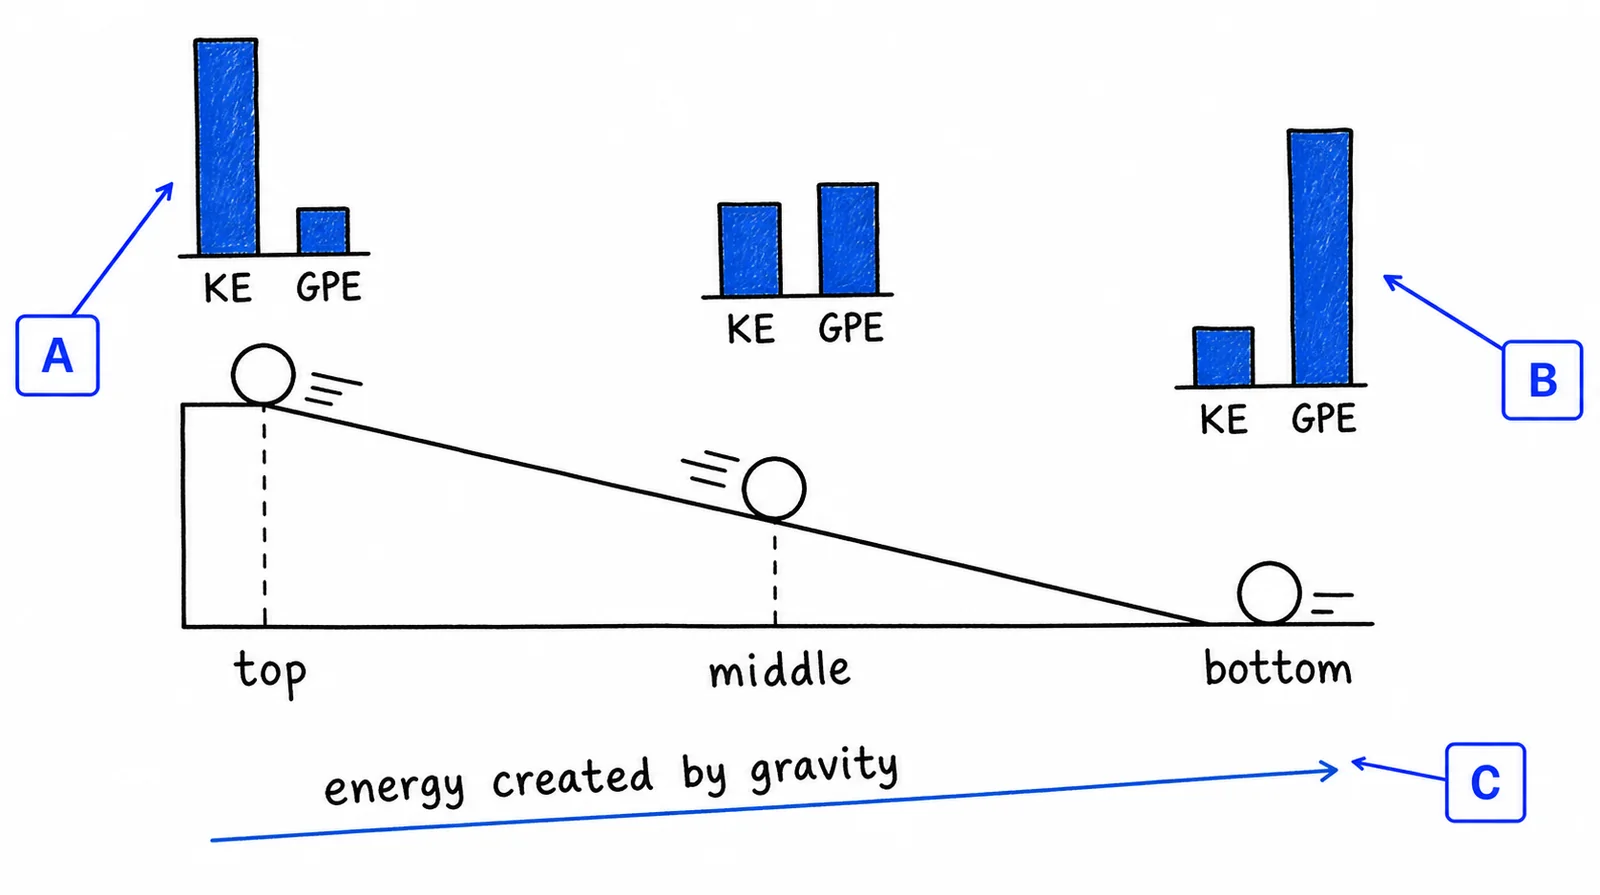
5.1 Error 1: What is wrong?
Correction:
5.2 Error 2: What is wrong?
Correction:
5.3 Error 3: What is wrong?
Correction:
Q1 — Snowy Hydro energy table
Total Emech = mghmax = 1000 × 9.8 × 300 = 2 940 000 J (constant throughout, frictionless).
h = 300 m: GPE = 2 940 000 J; KE = 0 J; v = 0 m/s; Emech = 2 940 000 J.
h = 200 m: GPE = 1 960 000 J; KE = 980 000 J; v = √(2 × 980 000/1000) = √1960 = 44.3 m/s; Emech = 2 940 000 J.
h = 100 m: GPE = 980 000 J; KE = 1 960 000 J; v = √(2 × 1 960 000/1000) = √3920 = 62.6 m/s; Emech = 2 940 000 J.
h = 0 m: GPE = 0 J; KE = 2 940 000 J; v = √(2 × 9.8 × 300) = √5880 = 76.7 m/s; Emech = 2 940 000 J.
1.2 As the water descends, GPE decreases and KE increases. Total mechanical energy (GPE + KE) remains constant at 2 940 000 J at every height on a frictionless track.
1.3 Actual KE at turbine = ½ × 1000 × 72² = ½ × 1000 × 5184 = 2 592 000 J. Elost = 2 940 000 − 2 592 000 = 348 000 J converted to thermal energy by friction and pipe resistance.
Q2 — Graph interpretation
2.1 Position C, where KE is at a maximum (120 kJ — the full dashed line height). At C the GPE = 0 (lowest point), so all mechanical energy has converted to kinetic energy, giving the highest speed.
2.2 KE at D = 60 000 J. v = √(2 × KE / m) = √(2 × 60 000 / 400) = √300 = 17.3 m/s.
2.3 Flaw: the constant total energy line does NOT mean energy is created. Energy is neither created nor destroyed. The dashed line demonstrates the Law of Conservation of Energy: as GPE decreases, an equal amount of KE increases, keeping the total constant. Gravity converts stored potential energy into kinetic energy — it does not create new energy.
Q3 — Compare and contrast table
Formula to use: Frictionless: KE1 + U1 = KE2 + U2. Real: KE1 + U1 = KE2 + U2 + Elost.
Total mechanical energy: Frictionless: constant at every point. Real: decreases continuously as friction converts ME to heat.
Speed at the bottom: Frictionless: v = √(2gh) — maximum possible. Real: v < √(2gh) because some energy was lost.
Energy not recovered as motion: Frictionless: zero — all PE converts to KE. Real: Elost = initial ME − final ME — converted to thermal energy and sound.
Effect of doubling mass: Frictionless: no effect on speed (mass cancels). Real: no effect on final speed either (mass cancels from Wnet = ΔKE when μ and geometry are fixed), but the energy values (PE, KE, Elost) all double.
Q4 — Snowy 2.0 pumped-hydro
4.1 ΔU = mgΔh = 1.0 × 106 × 9.8 × 360 = 3.528 × 10⁹ J (3.53 GJ).
4.2 Set mgh = ½mv² → divide both sides by m → gh = ½v² → v = √(2gh) = √(2 × 9.8 × 360) = √7056 = 84.0 m/s. Mass cancels completely.
4.3 Friction between water and pipe walls (pipe resistance / viscosity). The missing mechanical energy has been converted to thermal energy (heat) in the water and pipe walls.
Q5 — Diagram critique
5.1 Error 1 (KE and GPE swapped at the top): The diagram shows a tall KE bar at the top, but the car starts from rest so KE = 0 at the top. Correction: The GPE bar should be at its maximum height and the KE bar should be zero at the top of the drop.
5.2 Error 2 (KE and GPE swapped at the bottom): The diagram shows a tall GPE bar at the bottom, but at the reference level (h = 0), GPE = 0. Correction: At the bottom, the GPE bar should be zero and the KE bar should equal the original total mechanical energy.
5.3 Error 3 (total bar height increases): The total bar height (KE + GPE) increases from top to bottom, implying energy is being created by gravity. Correction: On a frictionless track, the total mechanical energy (KE + GPE) is constant at every position. The total bar height must be the same at every point; as GPE decreases, KE increases by exactly the same amount.