Chemistry • Year 11 • Module 1 • Lesson 8
Metallic Bonding and Properties
Apply the electron sea model to real data, real alloy comparisons, and novel engineering scenarios to consolidate exam-style reasoning skills.
1. Interpret data — melting point trends across Group 1, Group 2 and transition metals
The table below lists five metals with their group, approximate melting point, and approximate number of delocalised electrons per atom. 8 marks
| Metal | Periodic table group | Approx. MP (°C) | Delocalised e− per atom | Cation charge |
|---|---|---|---|---|
| Potassium (K) | 1 | 63 | 1 | +1 |
| Calcium (Ca) | 2 | 842 | 2 | +2 |
| Iron (Fe) | Transition | 1538 | 2–3+ | +2/+3 |
| Chromium (Cr) | Transition | 1907 | ~6 | +3/+6 |
| Tungsten (W) | Transition | 3422 | ~6 | +4/+6 |
1.1 Describe the general trend in melting point as you move from Group 1 metals to transition metals. 2 marks
1.2 Using the electron sea model, explain why calcium (842°C) has a significantly higher melting point than potassium (63°C). Refer specifically to ionic charge and the number of delocalised electrons. 3 marks
1.3 Both chromium and tungsten are in Period 6/4 of the periodic table and contribute ~6 delocalised electrons per atom. Using the data, suggest one additional factor that might explain why tungsten (3422°C) has a higher melting point than chromium (1907°C). 3 marks
2. Interpret graph — melting point vs number of delocalised electrons per atom
A student plotted the approximate melting points of eight metals against the number of delocalised electrons each contributes per atom. The graph is shown below. 7 marks
Figure 2.1. Approximate melting point vs number of delocalised electrons per atom for selected metals. Note: transition metals contribute d-electrons; values are approximate. Illustrative data based on CRC Handbook of Chemistry and Physics.
2.1 Describe the overall trend shown in the graph. 2 marks
2.2 Al (660°C, 3 electrons) and Fe (1538°C, ~3 electrons) have very similar numbers of delocalised electrons but very different melting points. Suggest why, using the electron sea model. 2 marks
2.3 A student concludes: “Melting point depends only on how many delocalised electrons a metal has.” Identify one limitation of this claim using evidence from the graph, and describe a factor the student has ignored. 3 marks
3. Compare pure metals and alloys across five features
Complete the two-column table below. For each feature, write a concise description that contrasts the two materials. 10 marks (1 per cell)
| Feature | Pure metal | Alloy |
|---|---|---|
| Lattice regularity | ||
| Layer sliding under force | ||
| Hardness | ||
| Malleability / ductility | ||
| Australian engineering example |
4. Predict and justify — Bondi Icebergs pool handrails
The iconic Bondi Icebergs ocean pool in Sydney uses stainless steel handrails (an alloy of iron, chromium ~18%, and nickel ~8%) rather than pure iron handrails. An engineer argues that pure iron would be cheaper to purchase initially but would need to be replaced every 3–5 years due to coastal corrosion.
5 marks
4.1 Predict whether stainless steel or pure iron would be harder and stronger. Justify your prediction using the electron sea model and the structure of alloys. 3 marks
4.2 The engineer’s claim implies a trade-off between initial cost and long-term durability. Using your knowledge of metallic and alloy properties, explain why stainless steel is the better material choice for ocean-pool handrails despite being more expensive initially. 2 marks
5. Diagram critique — what’s wrong with this student’s alloy diagram?
A Year 11 student drew the diagram below to explain why alloys are harder than pure metals. There are three errors in the diagram and its labels. Identify each error and write the correction. 6 marks (2 per error: 1 identify, 1 correct)
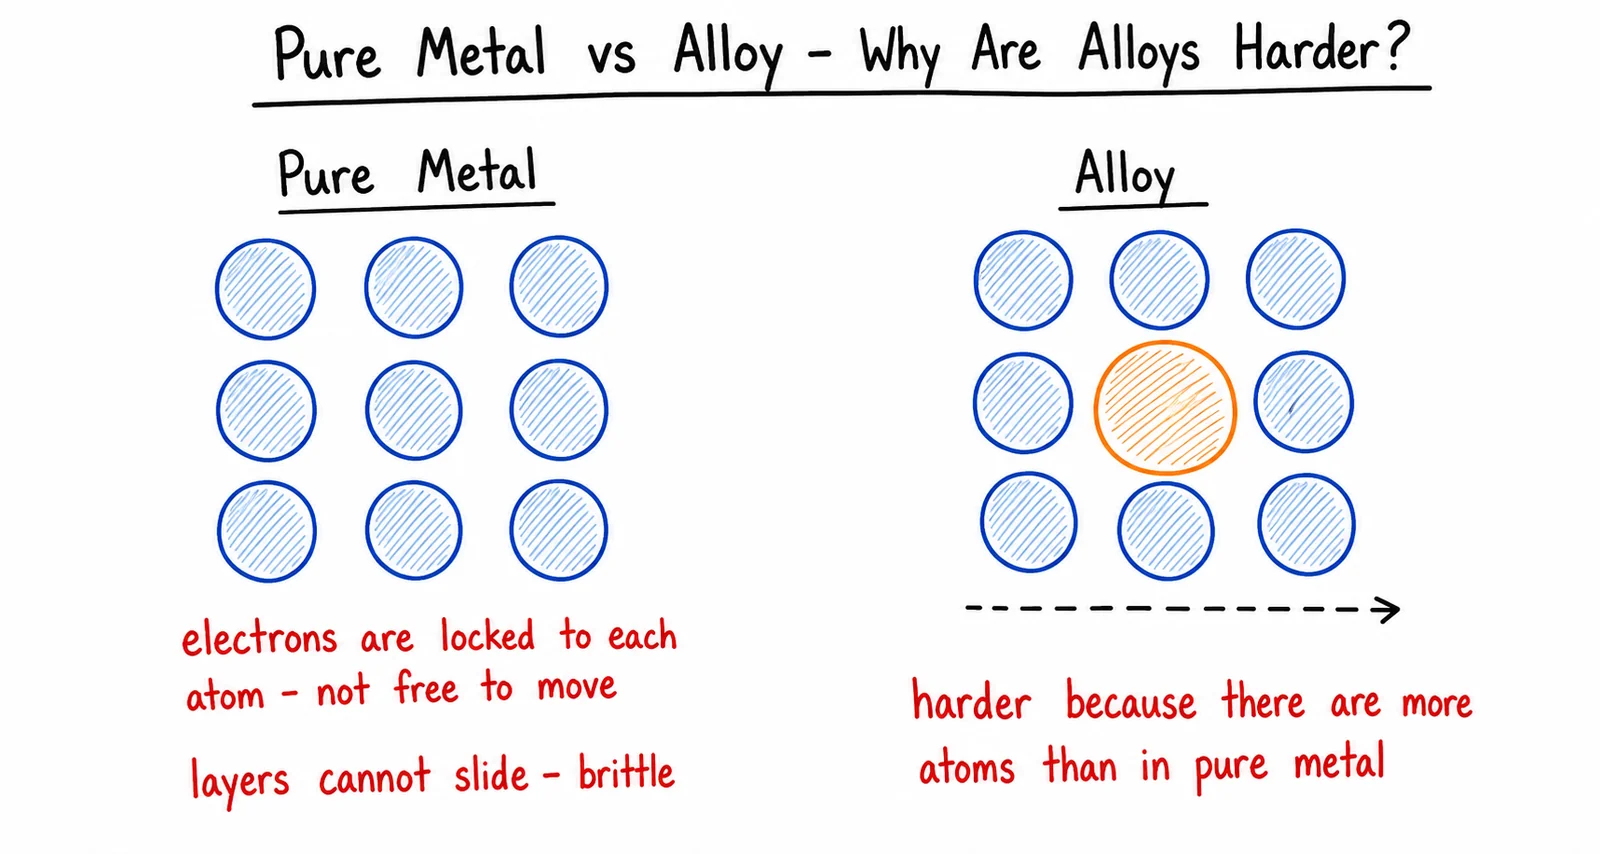
5.1 Error 1: What is wrong?
Correction:
5.2 Error 2: What is wrong?
Correction:
5.3 Error 3: What is wrong?
Correction:
Q1.1 — Trend in melting point
As you move from Group 1 metals (K, 63°C) to Group 2 metals (Ca, 842°C) to transition metals (Fe, Cr, W), the melting point increases significantly [1]. This trend reflects an increase in the strength of metallic bonding as the number of delocalised electrons per atom and the ionic charge both increase [1].
Q1.2 — K vs Ca melting point
Potassium (K, Group 1) releases 1 valence electron per atom, forming K+ with a +1 charge [1]. Calcium (Ca, Group 2) releases 2 valence electrons per atom, forming Ca2+ with a +2 charge and contributing twice as many electrons to the electron sea [1]. The electrostatic attraction between the denser electron sea (more electrons) and the higher-charge Ca2+ cation is substantially stronger than for K+, so more energy is needed to overcome the metallic bonding in Ca — hence Ca has a much higher melting point (842°C vs 63°C) [1].
Q1.3 — Cr vs W melting point
Both contribute ~6 delocalised electrons per atom. One additional factor is the size of the cation: tungsten has a much higher atomic number (74 vs 24 for Cr), and its cation carries a higher effective charge. Smaller cations are closer to the electron sea, producing a stronger electrostatic attraction between the cation lattice and the electron sea [1]. Tungsten’s higher cation charge density means a stronger overall electrostatic attraction and therefore a higher lattice energy [1]. Accept also: tungsten’s higher ionic charge produces stronger metallic bonding than chromium despite similar electron counts per atom, leading to a higher melting point [1].
Q2.1 — Graph trend
There is a general upward trend: as the number of delocalised electrons per atom increases from 1 (Group 1 metals) to ~6 (heavy transition metals), the melting point also increases, from approximately 29–98°C for Group 1 metals to over 3000°C for tungsten [1]. The relationship is not perfectly linear, and there is significant scatter at a given number of electrons [1].
Q2.2 — Al vs Fe (similar electrons, different MPs)
Both Al and Fe contribute approximately 3 delocalised electrons per atom. However, Fe2+/3+ has a higher ionic charge than Al3+ and a smaller ionic radius [1]. As taught in the lesson, higher cation charge and smaller ion size both strengthen the electrostatic attraction between the cation lattice and the electron sea. The stronger metallic bonding in Fe means more energy is required to overcome it, explaining its much higher melting point (1538°C vs 660°C) despite similar electron count per atom [1].
Q2.3 — Limitation of student’s claim
Limitation: Al and Fe both have ~3 delocalised electrons per atom, yet their melting points differ by ~878°C (660°C vs 1538°C), which contradicts the student’s claim that melting point depends only on electron count [1]. The student has ignored ionic charge (higher charge = stronger attraction to electron sea) [1] and ion size (smaller ions = closer to electron sea = stronger attraction = higher melting point) [1].
Q3 — Compare and contrast table
Lattice regularity: Pure metal: uniform lattice of identical-sized cations, perfectly regular. Alloy: foreign atoms of different sizes create local distortions in the regular lattice. Layer sliding: Pure metal: layers slide smoothly past each other because all ions are the same size. Alloy: layer sliding is impeded at the sites of foreign atoms — the size mismatch blocks smooth dislocation movement. Hardness: Pure metal: relatively soft (layers slide too easily). Alloy: harder, because greater force is needed to move layers past the distortions. Malleability / ductility: Pure metal: highly malleable and ductile (e.g. pure copper can be drawn into very fine wires). Alloy: less malleable and ductile due to lattice distortions impeding deformation. Australian engineering example: Pure metal: pure aluminium used in food-grade foil (requires malleability). Alloy: duralumin (Al + Cu + Mg + Mn) used in Qantas aircraft fuselage panels (requires high strength and low density).
Q4.1 — Stainless steel vs pure iron hardness
Stainless steel is harder and stronger than pure iron [1]. In pure iron, the regular lattice of identical Fe cations allows layers to slide relatively easily under force — the electron sea redistributes and maintains bonding through the deformation [1]. Stainless steel contains ~18% chromium and ~8% nickel atoms, which are different sizes from Fe. These foreign atoms create distortions in the Fe lattice, acting as obstacles that prevent smooth layer sliding when force is applied. Greater force is needed to deform the stainless steel, making it harder [1].
Q4.2 — Ocean pool handrail trade-off
Stainless steel is the better choice because it is harder and stronger than pure iron (as shown in 4.1), meaning it resists deformation and mechanical wear better in a high-traffic coastal environment [1]. Pure iron corrodes rapidly in saltwater conditions (as stated in the scenario), requiring costly replacement every 3–5 years. Despite stainless steel’s higher initial cost, its greater hardness and corrosion resistance (an improved property listed in the lesson’s alloy table: “corrosion resistant, harder”) make it far more cost-effective over the lifespan of the pool infrastructure [1].
Q5 — Diagram critique
5.1 Error 1 (electrons locked to atoms): In a metal, valence electrons are delocalised, not locked to individual atoms. [1 identify] Correction: In a metal, valence electrons leave their parent atoms and form a mobile “electron sea” shared across the entire structure; they are not associated with any specific atom [1 correct].
5.2 Error 2 (more atoms = harder): The label incorrectly states that alloys are harder because they have more atoms [1 identify]. Correction: Alloys are harder because the foreign atoms are a different size from the host metal atoms. This size difference distorts the regular lattice, preventing smooth layer sliding — it is the lattice distortion (not atom quantity) that increases hardness [1 correct].
5.3 Error 3 (pure metal layers cannot slide — brittle): The label incorrectly claims that pure metal layers cannot slide and that the metal is brittle [1 identify]. Correction: In a pure metal, the regular lattice of identical-sized ions means layers can slide easily past each other when force is applied (because there are no size-distorting obstacles), making pure metals malleable and ductile — not brittle [1 correct].