Chemistry • Year 11 • Module 1 • Lesson 2
Properties of Elements, Compounds and Mixtures
Apply your understanding of physical properties, sharp vs gradual melting, and compound vs element behaviour to real data, real scenarios and a diagram critique.
1. Interpret property data — classifying unknown substances
A chemist measures five physical properties of four unknown samples, X, Y, Z and W. Use the data table to answer the questions below. 8 marks
| Sample | Melting behaviour | Boiling behaviour | Conductivity (solid) | Conductivity (dissolved in water) | Density (g cm−³) |
|---|---|---|---|---|---|
| X | Sharp at 660°C | Sharp at 2519°C | Excellent | N/A (insoluble) | 2.70 |
| Y | Gradual, 48–72°C | Gradual range | None | None | Variable |
| Z | Sharp at 801°C | Sharp at 1413°C | None | Excellent | 2.16 |
| W | Sharp at 0°C | Sharp at 100°C | Very low | Very low (unchanged) | 1.00 |
1.1 For each sample, classify it as (a) element, (b) ionic compound, (c) covalent molecular compound, or (d) mixture. Justify each classification by citing specific data from the table. 4 marks (1 per sample)
1.2 Which sample most clearly demonstrates that a compound’s properties are NOT an average or combination of its elements? Name the likely compound and the elements it contains, and give one specific property that shows why this is true. 2 marks
1.3 Sample Y melts over a 24°C range. A student claims this proves Y is impure. A second student claims the range might be caused by thermometer error. Evaluate both claims, citing evidence from the lesson. 2 marks
2. Interpret graph — purity testing by melting point
A technician tests four samples of a substance claimed to be pure aspirin (MP 135°C). Each sample is heated slowly and the temperature recorded as it softens and melts. The graph below shows the melting behaviour of all four samples. 7 marks
Figure 2. Melting behaviour of four samples labelled “pure aspirin” by their respective suppliers. Pure aspirin melts sharply at 135°C. Illustrative data.
2.1 Identify which samples are consistent with being pure aspirin and which are mixtures. Justify using the graph data. 2 marks
2.2 Sample C melts sharply but at 133°C, not 135°C. Is Sample C pure aspirin? Explain your reasoning, identifying what further tests the chemist should perform. 3 marks
2.3 Sample D has the widest melting range (105–140°C). What does this indicate about its composition compared with Sample B (118–138°C)? 2 marks
3. Compare elements, compounds and mixtures across five criteria
Complete the three-column table below. For each criterion, write a concise description that distinguishes the three types of matter. 10 marks
| Criterion | Element | Compound | Mixture |
|---|---|---|---|
| Composition | |||
| Melting behaviour | |||
| Properties vs components | |||
| Conductivity (typical) | |||
| Australian or everyday example |
4. Predict and justify — Western Australian salt lake scenario
Lake Gairdner in South Australia is a large salt lake. In summer, the water evaporates and a thick white crust of NaCl forms on the lakebed surface. A researcher measures the boiling point of the brine (salty water) at different points across the lake and records values ranging from 100.5°C to 108.3°C depending on location. At one sampling point, the boiling point is almost exactly 100°C.
5 marks
4.1 Explain why the boiling point varies across the lake rather than being fixed at 100°C throughout. Use particle-level reasoning in your answer. 3 marks
4.2 The sampling point with a boiling point of ~100°C is described as “almost freshwater.” What does this boiling point data tell us about the purity of this water sample, and what one additional test would confirm it? 2 marks
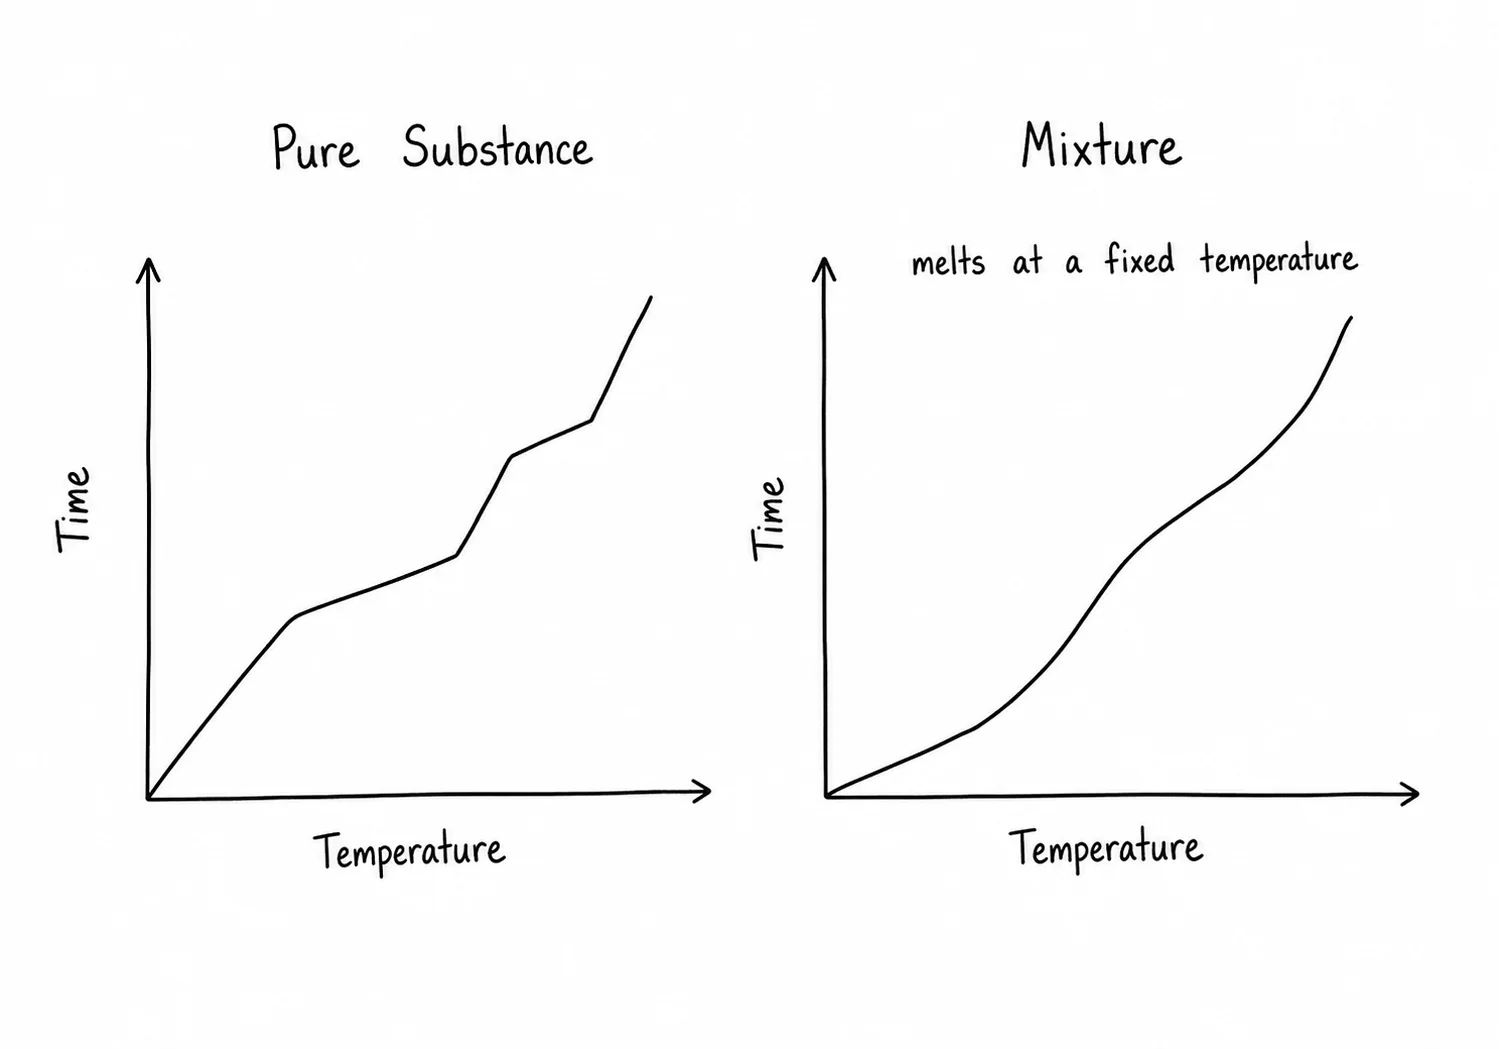
5. Diagram critique — what’s wrong with this student’s heating curve summary?
A Year 11 student drew the diagram below to summarise the differences between a pure substance and a mixture on a heating curve. There are three errors in the diagram. Identify each error and write the correction. 6 marks (2 per error: 1 identify, 1 correct)
5.1 Error 1: What is wrong?
Correction:
5.2 Error 2: What is wrong?
Correction:
5.3 Error 3: What is wrong?
Correction:
Q1.1 — Classification table (4 marks)
X — Element (metal): Sharp, fixed MP (660°C) confirms pure substance; excellent conductivity as a solid confirms metallic bonding (free electrons). Most ionic or covalent compounds do not conduct as solids. (Likely aluminium, Al.)
Y — Mixture: Gradual melting over a 24°C range (48–72°C) is direct evidence of a mixture. No conductivity in any state is consistent with a covalent organic mixture (e.g. a wax blend). Variable density also indicates mixed composition.
Z — Ionic compound: Sharp, fixed MP (801°C) confirms pure substance; no conductivity as a solid but excellent conductivity when dissolved in water confirms ionic bonding (ions fixed in solid lattice, mobile in solution). (Likely NaCl.)
W — Covalent molecular compound: Sharp, fixed MP (0°C) and BP (100°C) confirm pure substance; very low conductivity in any state confirms no free electrons or mobile ions. (Likely pure water, H&sub2;O.)
Q1.2 — Compound properties not an average (2 marks)
Sample Z (NaCl) best demonstrates this. NaCl is composed of sodium (a soft, reactive metal that explodes in water, MP 98°C, excellent conductor) and chlorine (a toxic yellow-green gas, MP −101°C, no conductivity). Yet NaCl is a white crystalline solid that is safe to eat, has a much higher MP (801°C), and does not conduct as a solid. Any one of these properties (e.g. NaCl is non-reactive with water, whereas Na explodes in water) directly shows the compound does not inherit element properties. [1 mark for naming NaCl and its components; 1 mark for a specific property comparison showing no inheritance.]
Q1.3 — Evaluate both claims (2 marks)
The first student is correct: a 24°C melting range is chemical evidence of a mixture, not an impurity in the thermometer-error sense. The second student is incorrect: thermometer inaccuracy accounts for at most ±1–2°C deviation. A 24°C span is far too large to be explained by measurement error; it indicates that different components in the sample begin melting at different temperatures because they have different bonding strengths. [1 mark for correctly evaluating claim 1; 1 mark for correctly dismissing claim 2 with quantitative reasoning.]
Q2.1 — Identify pure vs mixture samples (2 marks)
Samples A (sharp at 135°C) are consistent with pure aspirin — the transition is sharp and at the correct reference temperature of 135°C. Samples B and D are mixtures: both melt over a broad range (B: 118–138°C; D: 105–140°C), which is characteristic of variable composition. [1 mark for correctly identifying A as pure; 1 mark for correctly identifying B and D as mixtures with reference to their ranges.]
Q2.2 — Sample C at 133°C (3 marks)
Sample C shows a sharp melting transition, which indicates it is a pure substance rather than a mixture [1]. However, its melting point (133°C) is 2°C below the reference value for pure aspirin (135°C). This means Sample C is likely a different pure substance, or aspirin with a small amount of a soluble impurity that has slightly depressed the MP while still giving a relatively sharp transition [1]. To confirm identity, the chemist should: (i) measure at least one additional independent property (e.g. density or boiling point) and compare with reference data, and (ii) conduct a co-melting test: mix a small amount of Sample C with known pure aspirin and remeasure the MP — if the MP drops further, it confirms the samples are different substances [1].
Q2.3 — Sample D vs Sample B (2 marks)
Sample D has a broader melting range (35°C span) than Sample B (20°C span), indicating that Sample D is more “impure” or more mixed in composition [1]. The wider the melting range, the more variation there is in the local bonding environments within the mixture — more different components (or a greater proportion of contaminants relative to the main substance) are present, requiring a wider range of temperatures to fully melt [1].
Q3 — Compare and contrast table (10 marks, 2 per row)
Composition: Element: one type of atom only (e.g. Fe, Al, O&sub2;). Compound: two or more elements chemically bonded in a fixed ratio (e.g. NaCl, H&sub2;O). Mixture: two or more substances physically combined in variable proportions (e.g. salt water, alloys).
Melting behaviour: Element: sharp, fixed MP characteristic of that element. Compound: sharp, fixed MP characteristic of that compound. Mixture: melts over a range of temperatures; range width depends on composition.
Properties vs components: Element: not applicable (no components). Compound: completely different from its elements — new bonds create new properties. Mixture: properties are a weighted average or blend of the component properties.
Conductivity (typical): Element: metals conduct as solids (free electrons); non-metal elements generally do not (except graphite). Compound: ionic compounds conduct when molten or in solution; covalent compounds generally do not. Mixture: depends on components present.
Australian/everyday example: Element: iron (Fe) used in steel production at Port Kembla. Compound: NaCl (table salt) — used in food and chemical industry. Mixture: salt water in Sydney Harbour.
Q4.1 — Variable boiling point across lake (3 marks)
The brine is a mixture of water and dissolved NaCl (and possibly other salts). Because it is a mixture, its boiling point is not fixed — it depends on the concentration of dissolved ions [1]. At higher NaCl concentrations, the dissolved Na&sup+ and Cl&sup− ions interact with water molecules and require more energy to vaporise, raising the boiling point above 100°C [1]. Different sampling points have different concentrations of dissolved salt (because evaporation, rainfall and mixing vary across the lake surface), so the boiling point varies from point to point [1].
Q4.2 — Near-100°C sample (2 marks)
A boiling point very close to 100°C suggests the water sample has a very low dissolved-salt concentration — it is close to pure water but cannot be confirmed as pure from BP alone [1]. To confirm purity, measure conductivity: pure water has very low conductivity, while even dilute salt water conducts measurably better. If conductivity is also at the pure-water baseline, the sample is likely pure (or very close to pure) [1].
Q5 — Diagram critique (6 marks)
5.1 Error 1 (pure substance curve has a gradual slope instead of flat plateau): A gradual slope through the melting zone is incorrect for a pure substance [1]. Correction: A pure substance melts at a single fixed temperature; the heating curve must show a flat horizontal plateau during the melting transition. All particles are identical and require exactly the same energy to break free of the lattice, so temperature holds constant until the phase change is complete [1].
5.2 Error 2 (mixture labelled “melts at a fixed temperature”): A mixture does not melt at a fixed temperature [1]. Correction: A mixture melts over a range of temperatures (a gradual sloping transition on the heating curve), because different components have different intermolecular forces and require different amounts of energy to melt [1].
5.3 Error 3 (axes swapped — temperature on x, time on y): By convention, and as shown in the lesson, a heating curve plots temperature on the y-axis and time on the x-axis [1]. Correction: Temperature should be on the vertical y-axis; time should be on the horizontal x-axis. This convention allows the flat plateaus (constant temperature over time) to appear as horizontal lines [1].