Biology • Year 12 • Module 8 • Lesson 21
Module 8 Mastery, Integration Across All Inquiry Questions
Apply Module 8 frameworks to real data, a case-study scenario and a diagram critique, practising the mechanism-to-consequence-to-evidence chain that distinguishes Band 5 from Band 3 responses.
1. Interpret longitudinal HbA1c data
The graph below shows the glycated haemoglobin (HbA1c) levels for two groups of Australian adults diagnosed with Type 2 diabetes at the same time. Group 1 received standard care (quarterly GP visits). Group 2 received a structured multidisciplinary program, GP, dietitian, diabetes educator, exercise physiologist, with monthly reviews. Data are adapted from the DESMOND-style intervention trials reported in Primary Care Diabetes (Khunti et al., 2012). 8 marks
Figure 1.1. Mean HbA1c (%) over 24 months by care model. Adapted from Khunti et al. (2012), Primary Care Diabetes.
1.1 Describe the trend in HbA1c for each group from month 0 to month 24. 2 marks
1.2 By month 24, what is the difference in HbA1c between the two groups, and which group has achieved the clinical target of ≤7%? 2 marks
1.3 Using homeostasis language, explain why better glucose control (lower HbA1c) matters for the long-term kidney health of a Type 2 diabetes patient. 3 marks
1.4 Identify one limitation of this data set when drawing conclusions about whether multidisciplinary care prevents kidney disease in all Australian T2D patients. 1 mark
2. Trace the cause-and-effect chain, from insulin resistance to kidney disease
The cause boxes below are given; fill in the empty effect boxes to trace the pathway from insulin resistance to the need for dialysis. Finish with the overall outcome. 5 marks
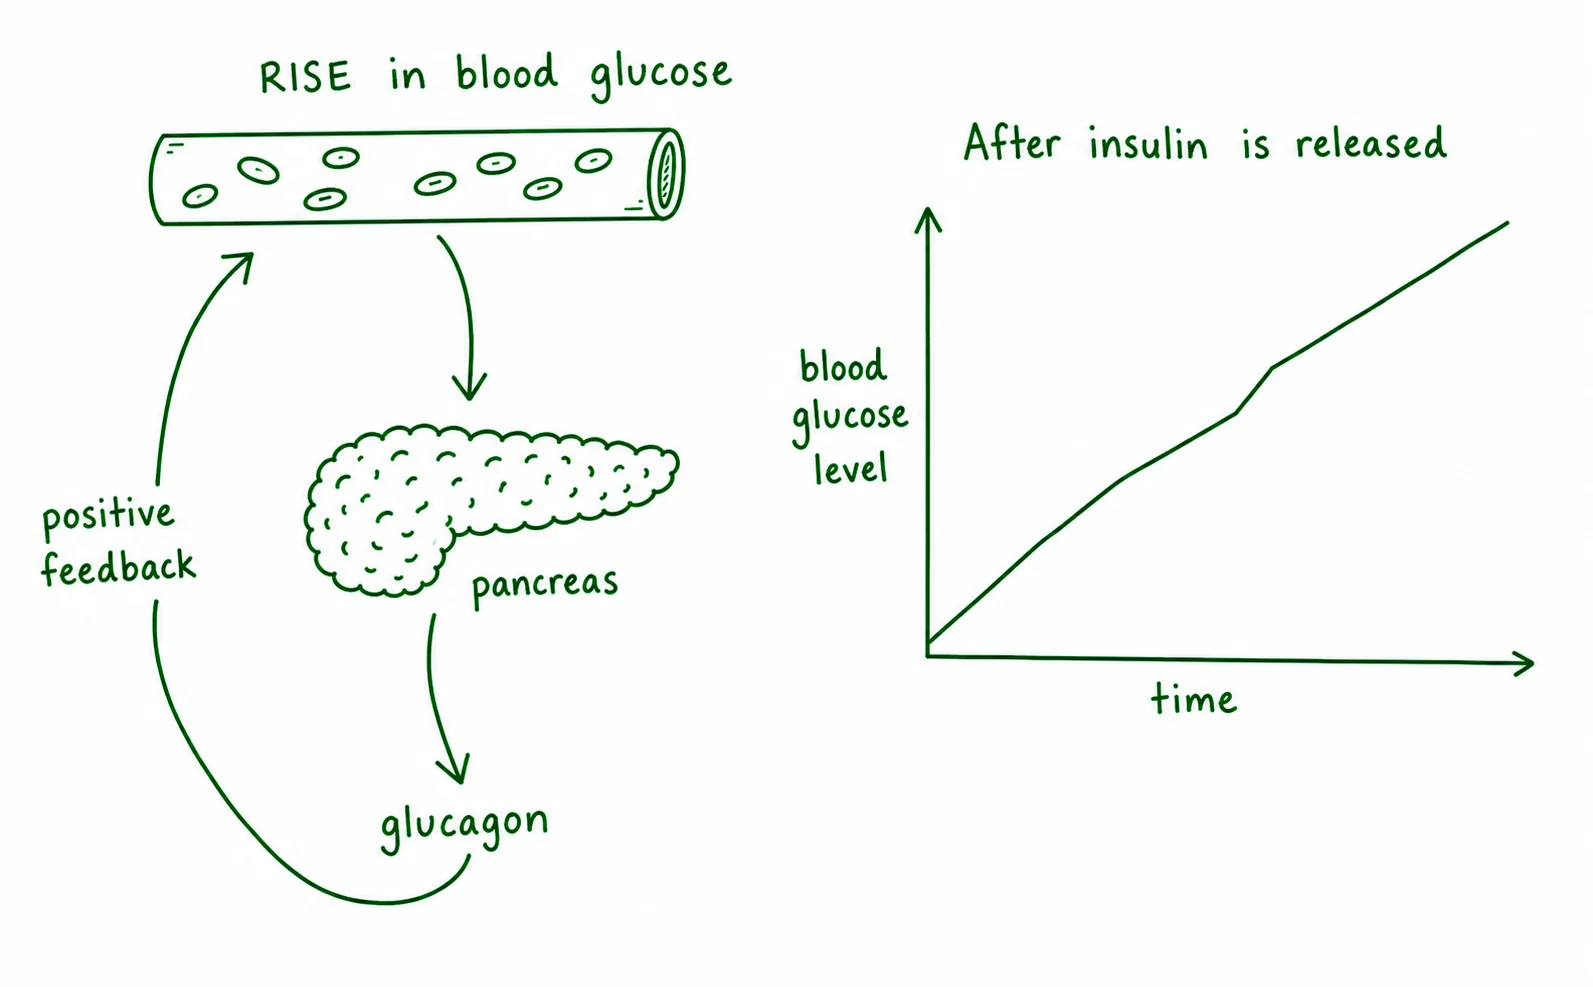
3. Diagram critique, identify the three errors in this student's homeostasis diagram
A student has drawn the diagram below to represent blood glucose homeostasis. There are three biological errors. Identify each error and write the correction. 6 marks, 2 per error: 1 identify, 1 correct
3.1 Error 1: What is wrong?
Correction:
3.2 Error 2: What is wrong?
Correction:
3.3 Error 3: What is wrong?
Correction:
4. Predict and justify, national bowel cancer screening in a regional context
The National Bowel Cancer Screening Program (NBCSP) in Australia mails a free faecal occult blood test (FOBT) kit to all Australians aged 50–74 every two years. Participation rates in remote and regional areas are approximately 25% lower than in major cities. 4 marks
4.1 Predict the likely effect of this participation gap on bowel cancer mortality rates in regional areas compared to cities, and justify your prediction using lesson content on prevention and disease burden. 3 marks
4.2 Suggest one reason why participation rates are lower in regional areas that is not simply a matter of patient choice. 1 mark
Q1.1, Trend description (2 marks)
Group 1 (standard care) shows a very slight, gradual decrease in HbA1c from 8.8% to 8.3% over 24 months, this change is small and HbA1c remains well above target throughout [1]. Group 2 (multidisciplinary) shows a steep initial decrease from 8.8% at baseline to 8.1% by month 6, then continues to fall progressively to 6.9% by month 24, entering the clinical target range [1].
Q1.2, Difference and target achievement (2 marks)
By month 24, Group 1 has HbA1c of 8.3% and Group 2 has 6.9%, a difference of 1.4 percentage points [1]. Group 2 has achieved the clinical target of ≤7% (sitting at 6.9%); Group 1 has not (at 8.3%) [1].
Q1.3, Why HbA1c matters for kidney health (3 marks)
HbA1c reflects average blood glucose over approximately three months. When blood glucose remains persistently above the normal range (as in poor glycaemic control), hyperglycaemia causes damage to small blood vessels, including the glomerular capillaries that filter the kidney [1]. Over time this reduces the efficiency of kidney filtration (glomerular filtration rate declines), progressing toward chronic kidney disease [1]. By reducing HbA1c toward the target range, multidisciplinary management restores glucose homeostasis more effectively, reducing the sustained vascular damage that drives kidney disease progression [1].
Q1.4, Limitation (1 mark)
Accept any one of: the study may not have controlled for confounders such as initial disease severity, socioeconomic status, or baseline medication use; the sample may not represent all Australian T2D patients (e.g. if it excluded Indigenous Australians or those in remote regions); 24 months may not be sufficient to measure kidney outcomes; HbA1c improvement does not guarantee CKD prevention. [1]
Q2, Cause-and-effect chain (5 marks)
Effect 1: Blood glucose is not taken up effectively, so it remains persistently elevated above the normal range (hyperglycaemia). [1]
Effect 2: Chronic hyperglycaemia damages blood vessels, including the small glomerular capillaries in the kidney (diabetic nephropathy begins). [1]
Effect 3: Glomerular filtration rate declines; the kidney can no longer effectively remove wastes and regulate fluid and electrolyte balance. [1]
Effect 4: Waste products accumulate in the blood (uraemia); the patient may require renal replacement therapy. [1]
Overall outcome: Long-term insulin resistance, if not controlled, can progress through a cascade of vascular and filtration damage to end-stage kidney disease requiring dialysis, illustrating why early homeostatic management and prevention (IQ1, IQ4) matter more than later technological intervention (IQ5). [1]
Q3, Diagram critique (6 marks)
3.1 Error 1 ("glucagon" labelling the rise-response): When blood glucose rises, the pancreas releases insulin, not glucagon. Glucagon is released when blood glucose falls below the normal range. Correction: replace "glucagon" with "insulin" on the arrow from pancreas to effector cells. [1 + 1]
3.2 Error 2 ("positive feedback"): The blood glucose control system is a negative feedback loop, the response (insulin → increased glucose uptake) counteracts the original change (rising blood glucose), returning it toward the set point. Positive feedback would amplify the deviation. Correction: label the feedback arrow "negative feedback". [1 + 1]
3.3 Error 3 (blood glucose rising after insulin release): The outcome of insulin release is that blood glucose falls back toward the normal range (around 4–6 mmol/L in a healthy person), cells take up glucose and the liver converts it to glycogen. Correction: show the blood glucose arrow returning downward toward the normal range after insulin is released. [1 + 1]
Q4.1, Prediction + justification (3 marks)
Lower NBCSP participation in regional areas means fewer cancers or pre-cancerous polyps are detected at an early, treatable stage [1]. Later-stage cancer at diagnosis is associated with lower survival rates and higher mortality [1]. Using the lesson's prevention framework: screening acts early in the disease pathway, when intervention is most effective; lower participation removes this advantage, increasing the disease burden (DALYs, mortality) in regional communities relative to cities [1].
Q4.2, Non-patient-choice reason (1 mark)
Accept any one of: limited access to follow-up colonoscopy services if the FOBT returns positive (no gastroenterology specialist locally); lower health literacy in some regional populations; language or cultural barriers for non-English-speaking residents; postal reliability issues in very remote areas causing kits not to arrive or not to be returned in time. [1]