Biology • Year 12 • Module 8 • Lesson 14
Treatment of Non-infectious Disease
Apply treatment mechanisms to real clinical data, a cause-and-effect chain, a current-event case study, and a diagram critique, practising the reasoning required for Band 4–5 HSC responses.
1. Interpret graph, DiRECT trial remission data
The graph below shows the percentage of Type 2 diabetes patients achieving remission (blood glucose returning to the non-diabetic range without medication) over 24 months in the UK DiRECT trial (2018). The trial compared a structured dietary weight-management programme against standard diabetes care. 8 marks
Adapted from: Lean et al. (2018). Primary care-led weight management for remission of type 2 diabetes (DiRECT): an open-label, cluster-randomised trial. The Lancet, 391(10120), 541–551.
1.1 Describe the trend for the weight-management intervention group from 0 to 24 months. 2 marks
1.2 Calculate the difference in remission rate between the intervention and control groups at 12 months. 1 mark
1.3 Using your understanding of the disease mechanism of Type 2 diabetes, explain why the weight-management intervention produced a much higher remission rate than standard care. 3 marks
1.4 The remission rate for the intervention group declined from 46% at 12 months to 36% at 24 months. Suggest one biological reason for this decline and explain why Type 2 diabetes remission is not considered a cure. 2 marks
2. Cause-and-effect chain, statins and cardiovascular disease
The cause boxes on the left are filled in. Complete the matching effect boxes on the right, tracing the statin mechanism from drug administration to reduced cardiovascular disease risk. 5 marks
| Cause | → | Effect (fill in) |
|---|---|---|
| Patient takes atorvastatin daily | → | 2.1 ___________________________________________ |
| HMG-CoA reductase is inhibited in the liver | → | 2.2 ___________________________________________ |
| Hepatic cholesterol synthesis decreases | → | 2.3 ___________________________________________ |
| Liver upregulates LDL receptors on its surface | → | 2.4 ___________________________________________ |
| Blood LDL concentration falls | → | 2.5 Overall outcome: _____________________________ |
3. Diagram critique, errors in a student's explanation of immune checkpoint inhibitors
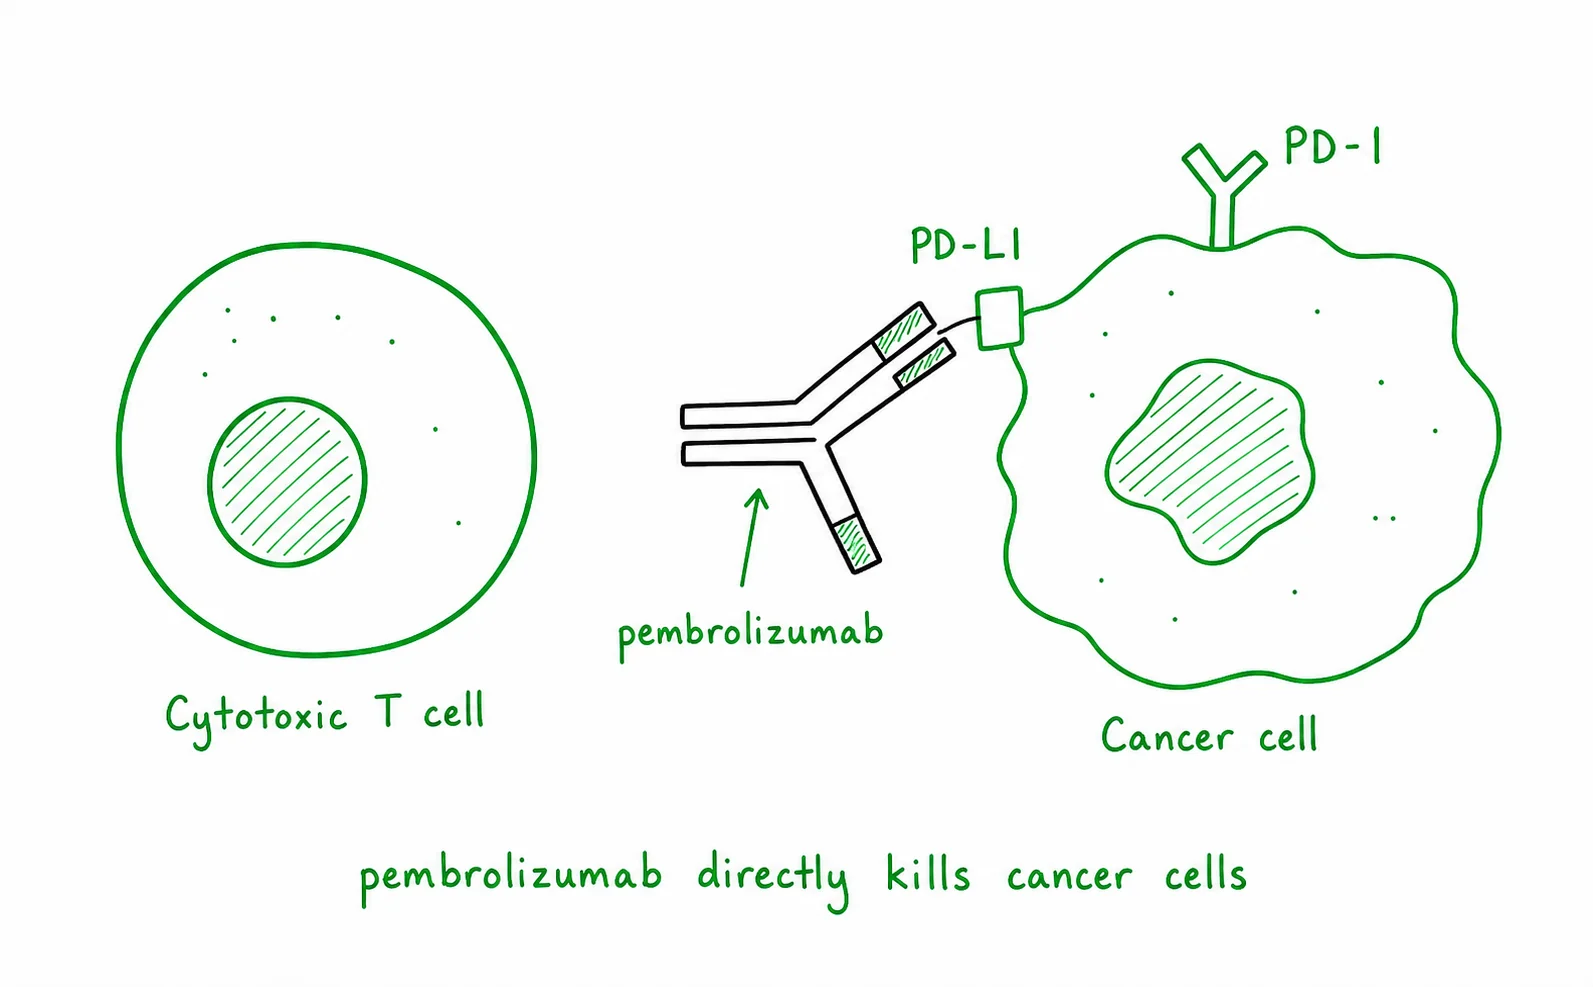
A Year 12 student has drawn the diagram below to explain how pembrolizumab treats cancer. There are three biological errors in the diagram. Identify each error and write the correction. 6 marks (2 per error: 1 identify, 1 correct)
3.1 Error 1: What is wrong?
Correction:
3.2 Error 2: What is wrong?
Correction:
3.3 Error 3: What is wrong?
Correction:
4. Case study, CAR-T therapy for relapsed B-cell leukaemia in Australia
Read the scenario below and answer all parts. 6 marks
Scenario. In 2021, the Australian Therapeutic Goods Administration (TGA) approved tisagenlecleucel (Kymriah), a CAR-T cell therapy, for children and young adults with relapsed or refractory B-cell acute lymphoblastic leukaemia (B-ALL) who had not responded to at least two prior treatment lines. In the pivotal trial (ELIANA), 83 out of 107 patients who received the infusion achieved overall remission, with 60 achieving complete remission with incomplete blood count recovery. Prior to CAR-T availability, these patients had median survival measured in weeks to months. CAR-T therapy is produced individually for each patient: their own T cells are collected via leukapheresis, genetically engineered in a laboratory to express a CD19-targeting CAR, expanded, quality-checked, and reinfused, the whole process takes approximately 3–4 weeks.
4.1 Explain what a Chimeric Antigen Receptor (CAR) is and how it allows the engineered T cells to recognise and kill B-ALL leukaemia cells specifically. 2 marks
4.2 Classify CAR-T therapy within the treatment framework from the lesson (root cause / mechanism / progression / symptom level) and justify your classification. 2 marks
4.3 Predict and justify one significant practical limitation of widespread use of CAR-T therapy in Australia, beyond the cost of the treatment itself. 2 marks
5. Compare targeted therapy vs cytotoxic chemotherapy for melanoma
Complete the comparison table. For each feature, fill in the relevant information for each treatment approach. 8 marks
| Feature | Cytotoxic chemotherapy (dacarbazine) | Targeted therapy (vemurafenib, BRAF inhibitor) |
|---|---|---|
| Molecular target | ||
| Mechanism of action | ||
| Specificity (all cancer types vs specific mutation?) | ||
| Main side-effect profile reason | ||
| Key limitation | ||
| Level of intervention (root cause / mechanism / progression / symptom) |
Q1.1, DiRECT trial trend (2 marks)
The weight-management intervention group showed a large increase in remission rate from 0% at baseline to 46% at 12 months [1 mark], followed by a partial decline to 36% at 24 months, remaining far above the control group throughout the trial [1 mark].
Q1.2, Difference at 12 months (1 mark)
46% − 4% = 42 percentage points. Accept 42% difference.
Q1.3, Mechanism of weight-loss remission (3 marks)
Weight loss reduces visceral adipose tissue volume [1 mark]. This decreases the secretion of pro-inflammatory adipokines (e.g. TNF-α, IL-6) that impair insulin receptor signalling in liver, muscle, and fat cells [1 mark]. As inflammatory interference reduces, insulin receptor sensitivity is restored and functionally exhausted pancreatic beta cells (which are not destroyed in T2D, unlike T1D) partially recover their glucose-stimulated insulin secretion capacity, returning blood glucose to normal without medication [1 mark].
Q1.4, Decline and "not a cure" (2 marks)
The decline from 46% to 36% most likely reflects partial weight regain in some patients as the programme's intensive support structure reduces at 12 months, some regained visceral fat re-establishes the adipokine-driven insulin resistance [1 mark]. Remission is not a cure because the underlying genetic predisposition to insulin resistance remains in every cell; if weight is regained, the disease recurs. The CFTR mutation analogy is useful: Trikafta improves function but the mutation persists; similarly, weight loss restores metabolic function but the susceptibility genes persist [1 mark]. Accept also: beta cell capacity can decline again if overworked.
Q2, Cause-and-effect chain (5 marks, 1 per effect)
2.1: Atorvastatin inhibits HMG-CoA reductase in hepatic cells (the rate-limiting enzyme for cholesterol synthesis). 2.2: Hepatic cholesterol production falls (less mevalonate pathway activity). 2.3: The liver, sensing reduced intracellular cholesterol, upregulates LDL receptor expression on its surface. 2.4: More LDL receptors clear more LDL from the bloodstream, reducing blood LDL concentration. 2.5 Overall: Less LDL is available to infiltrate arterial walls and oxidise, slowing atherosclerotic plaque formation and reducing cardiovascular disease risk.
Q3, Diagram critique (6 marks, 2 per error)
3.1 Error 1 (PD-1 location wrong): The diagram incorrectly shows PD-1 on the cancer cell surface. Correction: PD-1 (Programmed Death protein 1) is a receptor expressed on cytotoxic T cells, not on cancer cells. PD-L1 is the ligand expressed on cancer cells. [1 + 1]
3.2 Error 2 (pembrolizumab binding location): The diagram shows pembrolizumab binding to PD-L1 on the cancer cell. Correction: pembrolizumab is a monoclonal antibody that binds the PD-1 receptor on T cells, physically blocking the PD-L1/PD-1 interaction so that cancer cells cannot switch off T cell cytotoxic activity. (Note: some anti-PD-L1 drugs like atezolizumab do bind PD-L1 on cancer cells, but pembrolizumab specifically targets PD-1 on T cells.) [1 + 1]
3.3 Error 3 (mechanism of killing): The caption claiming pembrolizumab "destroys cancer cells directly by inserting into their membranes" is wrong. Correction: pembrolizumab does not directly kill cancer cells. By blocking PD-1 on T cells, it restores T cell cytotoxic function, the T cells then recognise and kill cancer cells using their normal cytotoxic mechanisms (perforin/granzyme pathway). Pembrolizumab works by disinhibiting the immune system, not by direct cytotoxic action. [1 + 1]
Q4.1, CAR-T mechanism (2 marks)
A Chimeric Antigen Receptor (CAR) is an engineered protein expressed on the surface of modified T cells that combines an extracellular antigen-recognition domain (derived from an antibody fragment targeting a tumour surface protein, in this case CD19 on B-ALL cells) with intracellular T cell activation signalling domains [1 mark]. When the CAR on the engineered T cell binds CD19 expressed specifically on B-ALL leukaemia cell surfaces, it activates the T cell's cytotoxic machinery, directing it to kill only cells expressing that target antigen, providing cancer-specific killing without requiring the normal T cell receptor/MHC recognition process [1 mark].
Q4.2, Classification (2 marks)
CAR-T therapy sits at the mechanism level of intervention, it does not correct the underlying genetic mutations that caused the leukaemia [1 mark], but it directly addresses the mechanism of the disease (malignant B-cell proliferation that evades immune surveillance) by engineering T cells to seek out and kill CD19-positive cancer cells. It could also be argued it approaches root-cause treatment in that it achieves complete remission in a substantial proportion of patients, but the underlying mutations driving leukaemogenesis are not corrected [1 mark]. Award marks for well-reasoned classification at either level.
Q4.3, Practical limitation (2 marks)
One significant limitation is the 3–4 week manufacturing window required to engineer each patient's T cells individually [1 mark]. For patients with rapidly progressing relapsed/refractory B-ALL, disease may advance significantly or the patient may deteriorate enough to become ineligible for infusion during this production period, some patients die or progress before their cells are ready. This also means CAR-T cannot be "off-the-shelf" and requires specialised manufacturing facilities and quality-control processes that are logistically complex and geographically limited [1 mark]. Accept also: "cytokine release syndrome" as a serious adverse effect requiring ICU-level management, limiting centres able to deliver it.
Q5, Comparison table (8 marks, ~1 per feature)
Molecular target: Chemo, non-specific (DNA / mitotic machinery of all rapidly dividing cells). BRAF inhibitor, mutant BRAF V600E kinase (cancer-specific oncogene product). Mechanism: Chemo, causes DNA damage or mitotic arrest in all rapidly dividing cells. BRAF inhibitor, specifically binds and inhibits the constitutively active BRAF V600E kinase, blocking the continuous proliferation signal driving melanoma growth. Specificity: Chemo, can treat many cancer types regardless of mutation profile. BRAF inhibitor, only effective in the ~50% of melanomas carrying the BRAF V600E mutation; requires genetic testing before use. Side-effect profile reason: Chemo, kills healthy rapidly dividing cells (hair follicles, bone marrow, gut epithelium) causing hair loss, nausea, immunosuppression. BRAF inhibitor, preferentially targets cancer-specific mutant protein, sparing normal cells; characteristic side effects (rash, arthralgia, paradoxical skin tumours) are milder and different in nature. Key limitation: Chemo, significant off-target toxicity; non-selective killing. BRAF inhibitor, resistance commonly develops within 6–18 months as cancer cells acquire bypass mutations; only works in BRAF V600E-positive tumours. Level: Both are at the mechanism level, neither corrects the underlying mutation(s) driving melanoma; both interrupt the malignant cell proliferation process (chemo broadly, BRAF inhibitor specifically).