Biology • Year 12 • Module 8 • Lesson 12
Epidemiology: Incidence, Prevalence, Mortality and Study Design
Lock in the three core disease measures, their formulas and differences, and the key features of each epidemiological study design.
1. Label the epidemiological measures diagram
The diagram below illustrates the relationship between incidence, prevalence and mortality in a population over time. Write the missing labels into boxes A–H. Draw from the lesson's formulas and Key Terms. 8 marks
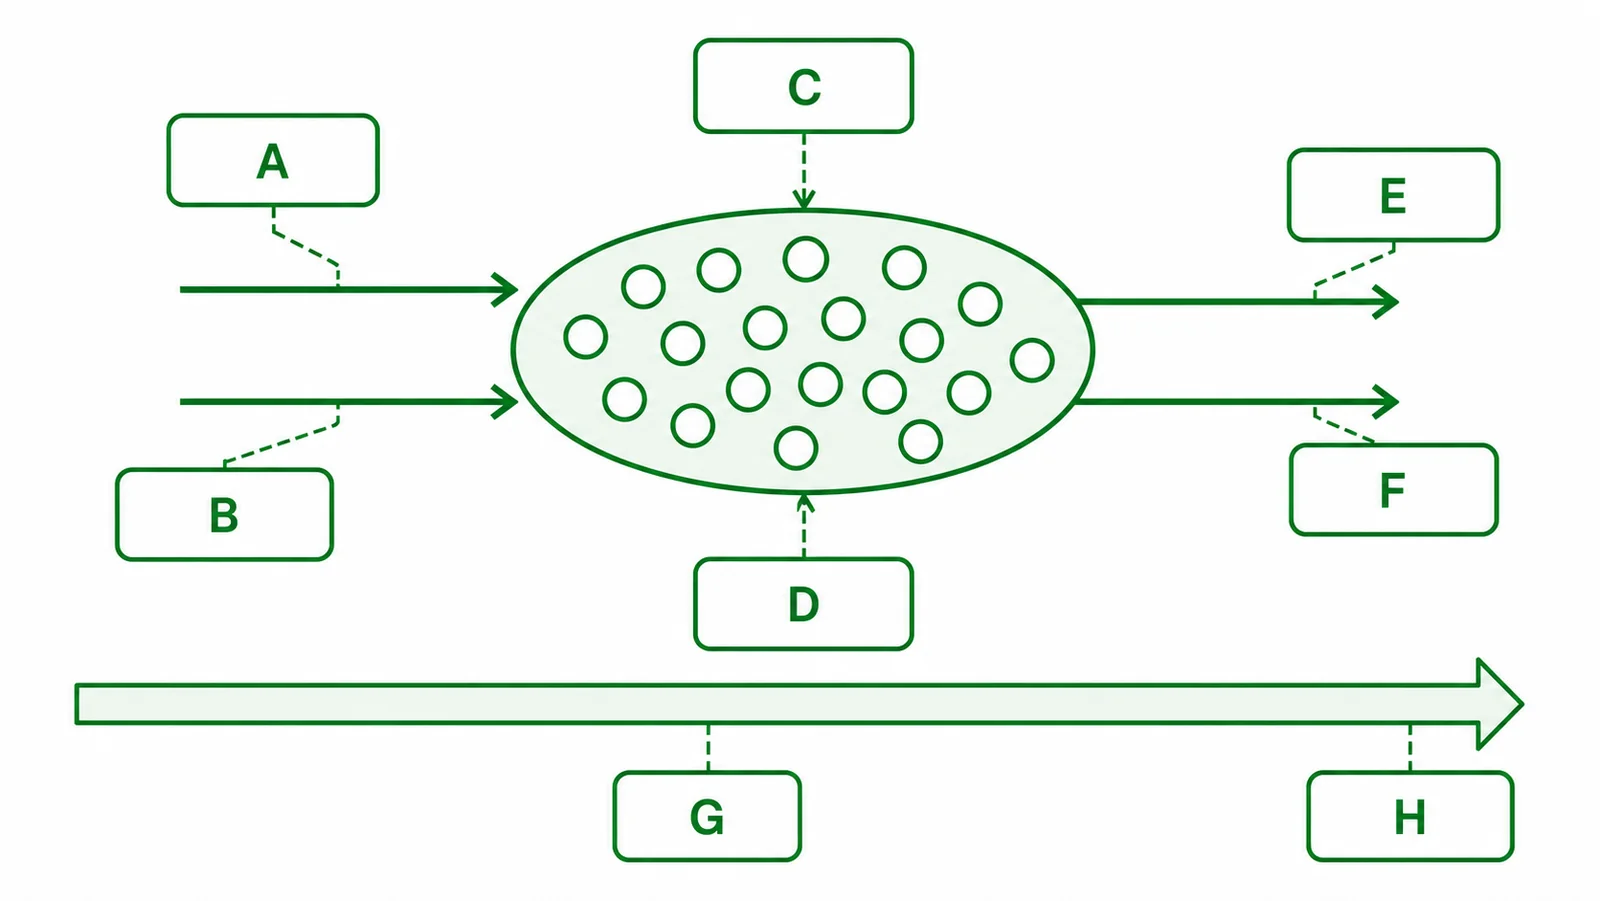
- A, the term for new cases entering the disease pool: _______________________
- B, term for the flow removing people who recover: _______________________
- C, term for the flow removing people who die: _______________________
- D, the measure that counts ALL existing cases at one point in time: _______________________
- E, complete the formula: Incidence rate = (________ ÷ population at risk) × 100,000
- F, complete the formula: Prevalence = (________ ÷ total population) × 100
- G, complete the formula: Mortality rate = (________ ÷ population) × 100,000 per year
- H, the adjustment applied to rates so that populations with different age structures can be fairly compared: _______________________
2. Term–definition match
Match each definition in the table to the correct term from this list: epidemiology, incidence, prevalence, mortality rate, confounding variable, age-standardised rate, cohort study, case-control study, cross-sectional study, randomised controlled trial. 10 marks
| # | Definition (shuffled) | Matching term |
|---|---|---|
| 2.1 | The study of the distribution and determinants of disease in populations, used to identify risk factors and guide public health policy. | |
| 2.2 | The number of NEW cases of a disease arising in a defined population during a specified time period. | |
| 2.3 | The total proportion of a population with a disease at a given point in time, includes both new and long-standing cases. | |
| 2.4 | The number of deaths from a disease per unit of population per unit of time. | |
| 2.5 | A variable associated with both the exposure being studied and the disease outcome, which can create a false or distorted apparent association. | |
| 2.6 | A rate adjusted for differences in age structure between populations, enabling valid comparison of disease rates across groups. | |
| 2.7 | A study that follows a disease-free group forward in time, comparing exposed versus unexposed subgroups for disease development. | |
| 2.8 | A study that starts with people who already have a disease (cases) and compares their past exposures with those of disease-free people (controls). | |
| 2.9 | A study that measures both exposure and disease at the same time point, a population snapshot used to calculate prevalence. | |
| 2.10 | A study in which participants are randomly assigned to intervention or control groups, the gold standard for establishing causation. |
3. True or false, with correction
Circle T or F for each statement. If the statement is false, write the corrected version on the line provided. 10 marks (1 T/F, 1 correction each)
3.1 Rising total numbers of a disease in a population always means the disease rate is increasing. T / F
3.2 Effective antiretroviral treatment for HIV can cause HIV prevalence to rise even if HIV incidence is falling. T / F
3.3 An RCT is the appropriate study design for investigating whether long-term asbestos exposure causes mesothelioma, because randomisation controls confounders. T / F
3.4 A case-control study is retrospective, it starts with people who already have the disease and looks back at their previous exposures. T / F
3.5 A statistical correlation between coffee drinking and lung cancer in data from the 1960s proves that coffee causes lung cancer. T / F
4. Function recall, why does it matter?
Answer each in 1–2 sentences using precise terms from the lesson. 8 marks (2 each)
4.1 Why is the incidence rate (new cases per 100,000) more useful than the total number of new cases when comparing disease burden across two countries of different sizes?
4.2 Why do epidemiologists use age-standardised rates rather than crude rates when comparing cancer mortality between Australia and Japan?
4.3 What is the key function of randomisation in a randomised controlled trial that makes it the gold standard for establishing causation?
4.4 Why is a case-control study more practical than a cohort study for investigating a rare disease such as mesothelioma?
5. Fill the blanks, the relationship between incidence, prevalence and treatment
Complete the paragraph below using the word bank. Each word is used once. 7 marks
The relationship between incidence and prevalence is captured by the formula: prevalence ≈ _______________ × average disease _______________. This explains a key epidemiological paradox. When effective _______________ therapy for HIV was introduced in high-income countries in the mid-1990s, HIV _______________ (new infections per year) began to fall due to prevention programs, yet HIV _______________ (all people living with HIV) rose, because people now survived for decades rather than dying within a few years. Similarly, when comparing cancer death rates between Australia and Japan, researchers must use _______________ rates rather than crude rates, because the two countries have different age structures. Failing to do so introduces _______________, making one country's rates appear falsely higher or lower than the other's.
Q1, Labelled diagram
A: Incidence (new cases per 100,000 per year, the rate of new cases flowing into the pool). B: Recovery (cases leaving because the person recovers). C: Death (cases leaving the living pool, counted by the mortality rate). D: Prevalence (all existing cases at one point in time). E: Number of NEW cases (numerator of the incidence rate formula). F: Number of EXISTING cases (numerator of the prevalence formula). G: Number of deaths from disease (numerator of the mortality rate formula). H: Age-standardisation (applying a standard age distribution to allow fair comparison between populations with different age structures).
Q2, Term–definition matches
2.1 epidemiology · 2.2 incidence · 2.3 prevalence · 2.4 mortality rate · 2.5 confounding variable · 2.6 age-standardised rate · 2.7 cohort study · 2.8 case-control study · 2.9 cross-sectional study · 2.10 randomised controlled trial.
Q3, True / false with correction
3.1 False. Correction: rising total numbers can reflect population growth, population ageing, or improved screening and diagnosis, not necessarily a rising rate. Rates (cases per 100,000) must be compared, not raw totals.
3.2 True. Effective treatment extends survival, people live longer with HIV, so the total pool of people living with HIV (prevalence) grows even as new infections (incidence) fall. Prevalence ≈ incidence × average disease duration; longer duration raises prevalence.
3.3 False. Correction: an RCT cannot be used for harmful exposures such as asbestos because it is unethical to randomly assign participants to inhale asbestos for decades. A case-control study (comparing past asbestos exposure in mesothelioma patients vs controls) is the most appropriate observational design for this question.
3.4 True. Case-control studies are retrospective, they begin with existing cases and controls, then look back at prior exposures. This is in contrast to cohort studies, which follow people prospectively from exposure to disease development.
3.5 False. Correction: a statistical correlation does not prove causation. In the 1960s, coffee drinkers were much more likely to also smoke, and smoking is the confounding variable, it is associated with both coffee drinking (social context) and lung cancer (causal). When controlled for smoking status, the coffee–lung cancer association largely disappears.
Q4.1, Incidence rate vs total cases
The incidence rate expresses new cases relative to population size (per 100,000), which allows fair comparison between countries regardless of how many people live there. A country with 1,000 new cases and a population of 1 million has a much higher rate (100 per 100,000) than a country with 5,000 new cases but a population of 100 million (5 per 100,000), the total number alone is misleading without accounting for the denominator.
Q4.2, Age-standardised rates for international comparison
Australia has an older age structure than Japan, and cancer rates increase strongly with age. Comparing crude rates would make Australia appear to have higher cancer mortality simply because its population is older, not because Australians are at higher risk for a given age. Age-standardisation applies a single reference age distribution to both countries' rates, removing the confounding effect of age structure and revealing the underlying disease risk at each age group.
Q4.3, Function of randomisation in RCTs
Randomisation distributes all known and unknown confounding variables equally between the intervention and control groups by chance. Because the only systematic difference between groups after randomisation is the intervention (drug, vaccine, treatment), any difference in outcomes can be attributed to the intervention rather than to pre-existing differences between groups. This is why RCTs provide the strongest evidence for causation.
Q4.4, Why case-control suits rare diseases
Mesothelioma is rare: a cohort study would need to follow hundreds of thousands of people for decades before enough cases accumulated to detect an association with asbestos, extremely slow and costly. A case-control study recruits people who already have mesothelioma (the rare outcome already exists) and compares their asbestos exposure histories with matched controls, making it far more efficient for studying rare diseases.
Q5, Cloze paragraph
In order: incidence · duration · antiretroviral · incidence · prevalence · age-standardised · confounding.
Full completed sentence: "prevalence ≈ incidence × average disease duration… effective antiretroviral therapy… HIV incidence… HIV prevalence… use age-standardised rates… introducing confounding."