Biology • Year 12 • Module 8 • Lesson 11
Causes Mastery: Diagnosing Disease Types, Mechanisms and Misconceptions
Apply disease classification, mechanism tracing, and data reasoning to real Australian contexts.
1. Interpret Australian cancer incidence data
The table below shows estimated percentage of Australian cancers attributed to selected risk-factor categories, adapted from AIHW (2023) Cancer in Australia. Use it to answer the questions. 7 marks
| Risk-factor category | Estimated % of total cancer burden attributable | Example carcinogen / mechanism |
|---|---|---|
| Tobacco smoke (chemical carcinogen) | 22% | PAHs → DNA adducts → TP53 mutation |
| UV radiation (physical carcinogen) | 15% | Thymine dimers → BRAF V600E activation |
| Overweight / obesity (nutritional) | 7% | Hyperinsulinaemia → IGF-1 signalling → cell proliferation |
| Biological carcinogens (HPV, H. pylori) | 4% | HPV E6/E7 → p53 + RB1 inactivation; H. pylori → chronic inflammation → TP53 mutation |
| Inherited / germline mutations | 5–10% | BRCA1/2 → defective DNA repair; Lynch syndrome (MLH1, MSH2) |
| Random replication errors (no known external cause) | ~40% | Polymerase errors accumulate with cell division rate × lifespan |
Adapted from AIHW (2023) Cancer in Australia. Percentages are approximate; totals do not sum to 100% because many cancers involve multiple contributing factors.
1.1 Identify which single risk-factor category is responsible for the greatest proportion of cancers in Australia, and state one specific carcinogen from this category with its mechanism. 2 marks
1.2 Using the data, evaluate the claim: "If all Australians stopped smoking and avoided UV, Australian cancer rates would be cut by at least half." Show your reasoning with figures. 3 marks
1.3 The table shows ~40% of cancers arise from random replication errors. A public health minister argues this means prevention programs are "pointless, most cancers are unavoidable." Use the lesson's framework to explain why this conclusion is incorrect. 2 marks
2. Interpret graph, BRCA1 carrier cumulative breast cancer risk vs general population
The figure below shows modelled cumulative breast cancer incidence by age in Australian women who carry a pathogenic BRCA1 variant versus the general population. 6 marks
Modelled cumulative risk curves, illustrative, consistent with Antoniou et al. (2003) Am J Hum Genet 72:1117-1130 and Australian data (AIHW 2023).
2.1 At age 50, estimate the cumulative breast cancer risk for BRCA1 carriers and for the general population. Calculate the approximate difference. 2 marks
2.2 Use the two-hit hypothesis and the concept of penetrance to explain why the BRCA1 carrier risk curve is steep but does not reach 100% by age 80. 2 marks
2.3 Explain why a BRCA1 carrier can correctly say "I have elevated susceptibility to breast cancer" but NOT "I have been diagnosed with breast cancer." Use the term penetrance in your answer. 2 marks
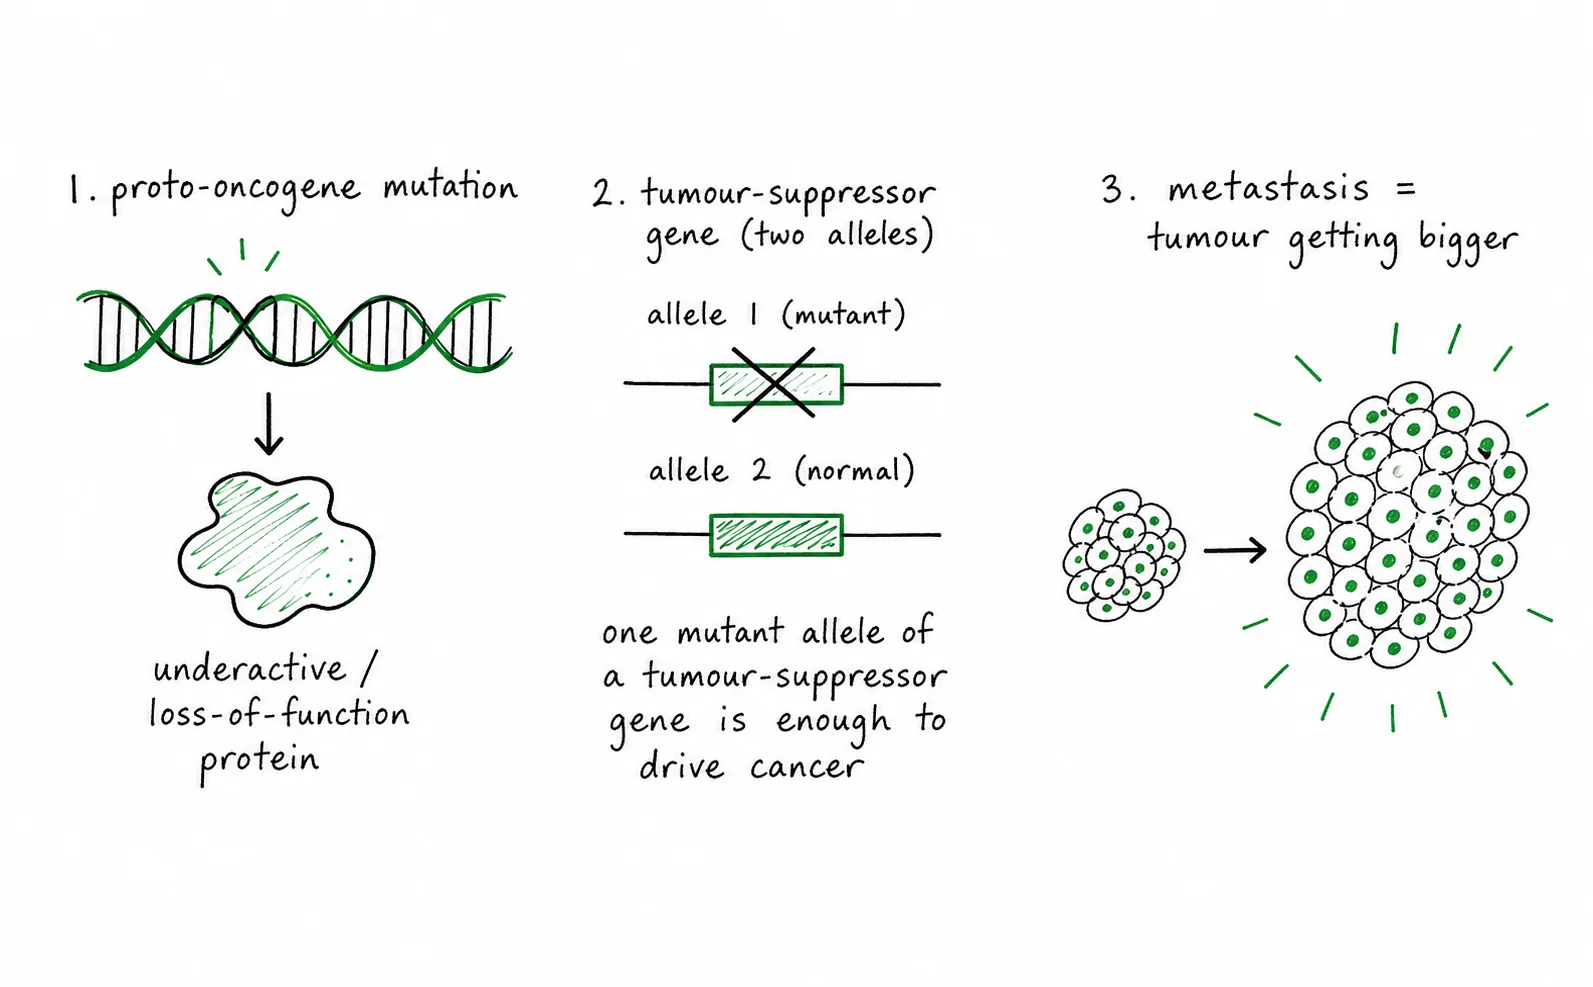
3. Diagram critique, three errors in a student's disease explanation
A Year 12 student has produced the diagram below to explain the cancer-driving mechanism. There are three biological errors in it. Identify each error and write the correction. 6 marks: 2 per error (1 identify, 1 correct)
3.1 Error 1: What is wrong?
Correction:
3.2 Error 2: What is wrong?
Correction:
3.3 Error 3: What is wrong?
Correction:
4. Case study, iodine deficiency and goitre in coastal and inland Australia
The Australian Institute of Health and Welfare (AIHW 2012) reported that iodine deficiency reemerged in Australia after decades of decline, affecting up to 50% of Australian schoolchildren in some regions. In response, Australian food regulations mandated iodine fortification of commercial bread (replacing non-iodised salt with iodised salt in baking) in 2009. 5 marks
4.1 Identify the disease category of iodine-deficiency goitre and explain, using a mechanism chain, why iodine deficiency causes the thyroid gland to enlarge. 3 marks
4.2 Explain why mandatory bread fortification is an environmental intervention that addresses a nutritional disease. Why would relying solely on individual dietary choice be less effective in Australia? 2 marks
Q1.1, Greatest Australian cancer risk factor (2 marks)
Tobacco smoke is the single greatest category, accounting for approximately 22% of the Australian cancer burden [1]. Specific example: polycyclic aromatic hydrocarbons (PAHs) in tobacco smoke form DNA adducts, causing G→T transversion mutations in TP53, removing the cell cycle checkpoint and permitting accumulation of further cancer-driving mutations [1].
Q1.2, Evaluate the "smoking + UV elimination" claim (3 marks)
The claim is a significant overstatement. Eliminating tobacco (22%) and UV (15%) would remove approximately 37% of cancer burden, less than half [1]. At least 40% of cancers arise from random replication errors unrelated to these exposures, and a further ~10–15% arises from inherited mutations, biological carcinogens, and obesity, none of which are addressed by eliminating smoking and UV alone [1]. Therefore the claim misrepresents the data: combined elimination of these two factors would substantially reduce but not halve cancer incidence, and would leave the majority of cancer burden unaddressed [1].
Q1.3, "Prevention is pointless" (2 marks)
The conclusion is incorrect because 22% + 15% + 7% + 4% = 48% of cancers in the table involve modifiable risk factors that prevention programs can meaningfully reduce [1]. Even if ~40% of cancers arise from replication errors beyond current prevention, the fact that nearly half involve preventable exposures demonstrates that population-level prevention programs produce large absolute reductions in cancer incidence and mortality [1].
Q2.1, Cumulative risk at age 50 (2 marks)
At age 50: BRCA1 carriers approximately 45% risk; general population approximately 3.5% risk [1]. Approximate difference: 41–42 percentage points [1]. (Accept ±5 percentage points.)
Q2.2, Two-hit hypothesis + penetrance (2 marks)
BRCA1 carriers have an inherited (first-hit) inactivating mutation in one BRCA1 allele in every cell. Cancer only develops if a second somatic mutation inactivates the remaining functional allele in a specific breast cell [1]. Whether and when that somatic second hit occurs in any individual's lifetime is probabilistic, not all carriers acquire it. Penetrance (~70% by age 80) reflects the statistical probability of the second hit occurring across a lifetime, which is why the curve rises steeply but does not reach 100% [1].
Q2.3, Susceptibility vs diagnosis (2 marks)
"Elevated susceptibility" correctly describes carrying an inherited BRCA1 mutation that raises cancer risk, a genotypic state before any cancer has developed [1]. "Diagnosed with breast cancer" requires the disease to be present (tumour exists, confirmed by biopsy). Penetrance is not 100%: ~30% of carriers never develop cancer during their lifetime, so the mutation does not equal the disease, they are at elevated risk, not inevitable patients [1].
Q3, Diagram errors (6 marks)
3.1 Error 1: The arrow claims a proto-oncogene mutation "becomes a tumour suppressor", wrong gene class. Proto-oncogenes and tumour suppressor genes are entirely separate gene families with opposite normal functions. Correction: a proto-oncogene mutation produces an oncogene (gain-of-function), which constitutively drives cell division. It does not become a tumour suppressor. [1 + 1]
3.2 Error 2: The diagram labels tumour suppressor mutation as "dominant, one mutant copy removes the brake." Tumour suppressor mutations are loss-of-function and recessive: both alleles must be inactivated (two-hit hypothesis) before the brake is lost. Correction: one mutant allele is usually insufficient, the remaining functional allele still brakes division. A second somatic mutation is required to fully inactivate the gene. [1 + 1]
3.3 Error 3: The diagram defines metastasis as "primary tumour grows large enough to compress nearby organs." This describes local tumour growth, not metastasis. Correction: metastasis is the process by which malignant cells detach from the primary tumour, invade blood or lymphatic vessels, survive in circulation, exit at distant sites, and establish secondary tumours in organs such as the liver, lungs, or brain. [1 + 1]
Q4.1, Iodine-deficiency goitre mechanism (3 marks)
Disease category: nutritional disease (caused by iodine deficiency, a deficiency of an essential micronutrient) [1]. Mechanism chain: insufficient dietary iodine → thyroid cannot synthesise adequate T3 and T4 hormones → falling T3/T4 levels remove negative feedback on the anterior pituitary → anterior pituitary secretes elevated TSH (thyroid-stimulating hormone) → chronically elevated TSH stimulates thyroid cell proliferation and hyperplasia → compensatory enlargement of the gland (goitre) [2-1 mark for the feedback element, 1 mark for the cellular consequence].
Q4.2, Fortification as environmental/nutritional intervention (2 marks)
Mandatory iodisation of bread salt is an environmental intervention: it alters the food supply at a population level, ensuring that people receive adequate iodine regardless of individual dietary choices or knowledge [1]. Relying solely on individual choice is less effective in Australia because iodine is absent from most soils in large inland and coastal regions, meaning local produce is inherently low in iodine; additionally, socioeconomic factors limit dietary variety for many Australians, so population-level food fortification reaches groups who cannot or do not access iodine-rich foods (e.g. seafood, dairy) [1].