Biology • Year 12 • Module 8 • Lesson 9
Nutritional Diseases: Deficiency, Excess and Diet-related Disorders
Apply the nutrient → function → consequence framework to real Australian data, a cause-and-effect pathway, and a diagram critique.
1. Interpret Australian nutritional disease prevalence data
The table below shows selected nutritional disease statistics for Australia, drawn from AIHW (2022) and the Australian Bureau of Statistics (2022). Use it to answer the questions below. 7 marks
| Condition | Estimated Australian prevalence | Primary at-risk group(s) | Primary dietary driver |
|---|---|---|---|
| Vitamin D deficiency (<50 nmol/L serum 25-OH D) | ~23% of Australians | Darker skin; indoor workers; covering clothing | Insufficient UVB exposure; low oily fish intake |
| Iron deficiency anaemia | ~8% women 18–50 yrs; ~2% men | Premenopausal women; pregnant women; vegetarians | Insufficient haem or non-haem iron intake; blood loss |
| Type 2 diabetes (diagnosed) | ~1.3 million (~5% adults) | All adults, especially Indigenous Australians (3× rate) | Excess refined carbohydrates; saturated fat; sedentary lifestyle |
| Cardiovascular disease | Leading cause of death (~10% of all deaths) | Males >45 yrs; postmenopausal women; familial hypercholesterolaemia | Excess saturated fat; low fruit/vegetable intake; smoking |
| Iodine insufficiency (mild) | Re-emerging; ~9% children | School-age children; pregnant women; low bread-eaters | Declining iodised salt and bread use |
1.1 Compare the at-risk populations for iron deficiency anaemia and vitamin D deficiency. Identify one group that is at elevated risk for both conditions and explain why using lesson content. 3 marks
1.2 The table shows that iodine insufficiency is re-emerging in Australia despite a mandatory iodised salt program introduced in 2009. Propose a hypothesis to explain this re-emergence using information in the table. 2 marks
1.3 Australia simultaneously has high rates of both vitamin D deficiency and Type 2 diabetes, a pattern called the “double burden of malnutrition.” Using lesson content, explain how this paradox can exist in a high-income country. 2 marks
2. Interpret graph, blood glucose over time in Type 2 diabetes progression
The figure below models how fasting blood glucose changes over years in a person with progressive insulin resistance, compared to a healthy individual. Adapted from UK Prospective Diabetes Study (UKPDS) progression data. 7 marks
2.1 Describe the trend in fasting blood glucose for the T2D progression group from year 0 to year 15. 2 marks
2.2 At approximately what year does the T2D progression group cross the diagnostic threshold of 7.0 mmol/L? Using lesson content, explain why the diagnosis typically occurs at this point rather than at year 0 when insulin resistance first develops. 3 marks
2.3 Using the graph and lesson content, explain why blood glucose continues to rise steeply between year 10 and year 15 in the T2D group, even in the absence of any further increase in refined carbohydrate intake. 2 marks
3. Cause-and-effect chain, from iodine deficiency to cretinism
The cause boxes on the left are provided. Fill in the missing effect boxes on the right at each step. Write the overall outcome at the bottom. 5 marks
| Cause | → | Effect (fill in) |
|---|---|---|
| Pregnant woman has severe iodine deficiency | → | |
| Foetal thyroid cannot synthesise adequate T3/T4 | → | |
| Thyroid hormones are essential for normal brain development | → | |
| Foetal neurons fail to differentiate and myelinate normally | → |
Overall outcome (so…): Severe iodine deficiency during pregnancy results in…
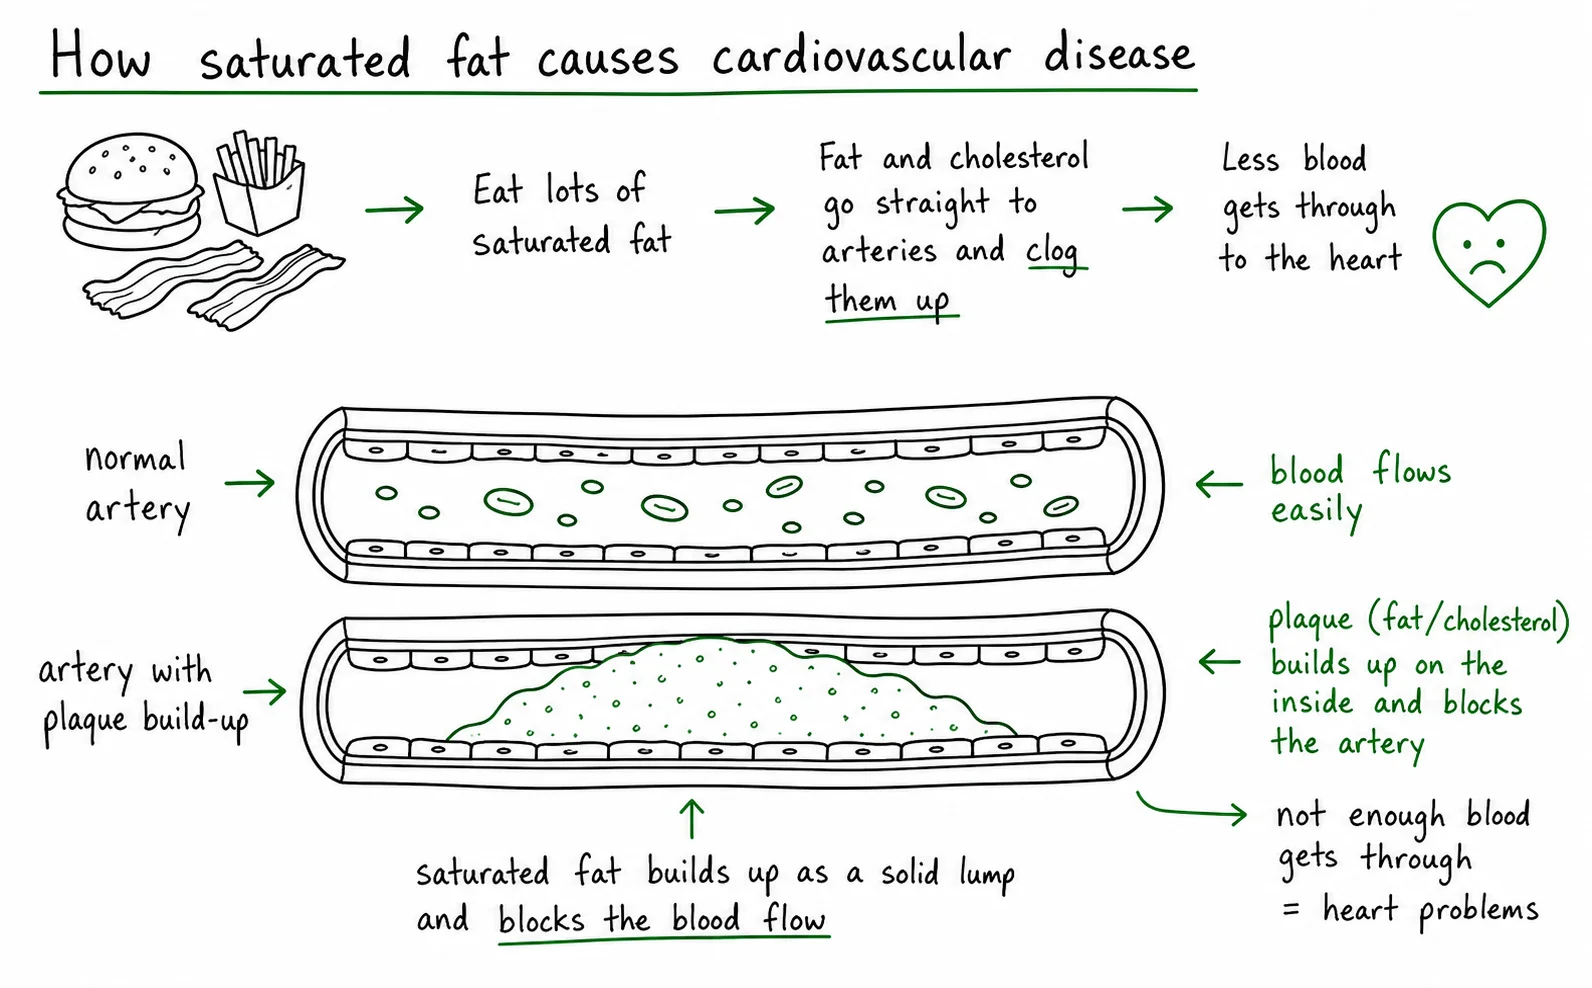
4. Diagram critique, what is wrong with this student’s atherosclerosis diagram?
A Year 12 student has drawn the diagram below to explain how saturated fat causes cardiovascular disease. There are three biological errors in the diagram. Identify each error and write the correction. 6 marks (2 per error: 1 identify, 1 correct)
4.1 Error 1: What is wrong?
Correction:
4.2 Error 2: What is wrong?
Correction:
4.3 Error 3: What is wrong?
Correction:
5. Apply to a new scenario, a remote community health audit
A nurse in a remote Northern Territory community reports the following findings in a health audit of 50 adults: 34% have Type 2 diabetes; 28% have iron deficiency anaemia; 19% have vitamin D deficiency; 14% have mild iodine insufficiency. The community has limited access to fresh produce, primarily consuming processed foods, white rice, and some kangaroo meat. Most adults work outdoors. 5 marks
5.1 Using the lesson’s nutrient → function → consequence framework, identify the most likely nutritional explanation for the high rate of iron deficiency anaemia in this community, given that kangaroo meat is an iron-rich food. 2 marks
5.2 The community works outdoors yet has 19% vitamin D deficiency. Using lesson content, give two possible reasons why outdoor work alone is insufficient to prevent deficiency in this population. 2 marks
5.3 A policymaker suggests that providing free vitamin supplements would solve all nutritional problems in this community. Identify one reason this approach alone is insufficient for Type 2 diabetes prevention. 1 mark
Q1.1, Comparing at-risk groups (3 marks)
Iron deficiency anaemia particularly affects premenopausal women (menstrual blood loss depletes iron stores), pregnant women (foetal iron demand), and vegetarians (non-haem iron from plant sources is absorbed at only 2–10% efficiency vs 15–35% for haem iron). Vitamin D deficiency particularly affects those with darker skin (melanin reduces UVB penetration), indoor workers, and those covering their skin. Pregnant women are at elevated risk for both: they have high iron demand for foetal haemoglobin synthesis, and many may reduce sun exposure or have dietary changes. Award 1 mark for correctly describing at-risk groups for each condition, 1 mark for identifying a shared at-risk group with a valid explanation.
Q1.2, Hypothesis for re-emerging iodine insufficiency (2 marks)
The mandatory iodised salt program (2009) added iodine to bread, but the table notes that re-emergence correlates with declining iodised salt and bread use. Hypothesis: as Australians consume less commercially baked bread (e.g. moving to sourdough, gluten-free alternatives, or low-carbohydrate diets) and substitute non-iodised salt forms (e.g. sea salt, Himalayan salt) for iodised table salt, total iodine intake from these previously reliable sources falls, reducing the effectiveness of the fortification program at the population level. [1 mark for identifying reduced iodised salt/bread consumption; 1 mark for mechanistic link to declining iodine intake.
Q1.3, Double burden of malnutrition paradox (2 marks)
The paradox exists because the two categories of nutritional disease have different drivers. Dietary excess diseases (T2D, CVD) are driven by chronic consumption of calorie-dense, nutrient-poor processed foods, which are cheap and widely available in Australia. Micronutrient deficiency diseases (vitamin D, iron) arise not from total calorie shortage but from specific nutrient shortfalls, caused by indoor lifestyles, sunscreen use, low fruit and vegetable intake, and reliance on the same cheap processed foods that supply excess calories but few micronutrients. A person can be simultaneously overfed in calories and underfed in micronutrients. [1 mark each for explaining the two separate mechanisms.]
Q2.1, Blood glucose trend description (2 marks)
The T2D progression group begins at approximately 5.2 mmol/L (normal range), with blood glucose rising slowly during years 0–8, then more steeply from year 8–15, reaching approximately 11–12 mmol/L by year 15, well above the diagnostic threshold of 7.0 mmol/L. [1 mark for identifying a gradual then accelerating rise; 1 mark for quantifying with reference to the graph values.]
Q2.2, Diagnostic threshold crossing and delayed diagnosis (3 marks)
The T2D group crosses 7.0 mmol/L at approximately year 10–11. Year 0 represents the onset of insulin resistance, not diabetes, diagnosis does not occur then because the pancreatic beta cells initially compensate by producing more insulin, maintaining blood glucose within normal range despite reduced receptor sensitivity [1 mark]. Over years 0–10, the elevated insulin output partially overcomes the resistance, keeping glucose borderline-elevated but below the diagnostic threshold [1 mark]. By year 10–11, beta cells begin to exhaust from chronic overproduction, insulin secretion falls, and blood glucose rises above 7.0 mmol/L, the diagnostic threshold [1 mark].
Q2.3, Why glucose rises steeply years 10–15 (2 marks)
Between year 10 and 15, beta cell exhaustion means insulin secretion is actively declining rather than merely insufficient [1 mark]. With both insulin resistance (cells not responding) and reduced insulin production (beta cells exhausted), the two defects compound each other, glucose removal from the blood is severely impaired on two fronts simultaneously, causing the steep accelerating rise seen in the graph [1 mark].
Q3, Cause-and-effect chain answers
Row 1 effect: The foetus receives insufficient iodine from the mother’s circulation for thyroid hormone synthesis.
Row 2 effect: Foetal thyroid hormone (T3/T4) levels are severely low throughout critical periods of brain development.
Row 3 effect: Foetal brain development is severely impaired, neuronal proliferation, differentiation, and myelination are disrupted during critical developmental windows.
Row 4 effect: Permanent intellectual disability, impaired motor function, and growth failure result.
Overall outcome: Severe iodine deficiency during pregnancy results in cretinism in the child, a form of severe intellectual disability and developmental impairment that is irreversible once the critical windows of foetal brain development have passed without adequate thyroid hormone.
Q4, Diagram critique (6 marks)
4.1 Error 1: Saturated fat is shown depositing directly as a solid lump inside the artery lumen like a pipe blockage, this is the “blocked pipe” misconception. Correction: Saturated fat raises blood LDL cholesterol; LDL particles infiltrate the arterial wall endothelium, oxidise, and trigger an inflammatory response that forms plaques within the arterial wall, not as a lump in the lumen. [1+1]
4.2 Error 2: Macrophages are incorrectly labelled as “T cells.” Correction: Macrophages (not T cells) are recruited to the site of LDL oxidation; they engulf oxidised LDL through scavenger receptors and become lipid-laden foam cells. T cells are lymphocytes of the adaptive immune system, they are not the primary cell type forming foam cells in atherosclerosis. [1+1]
4.3 Error 3: The caption claims all types of fat are equally harmful. Correction: Different fats have different effects on LDL cholesterol. Saturated fats and trans fats raise LDL; polyunsaturated fats (omega-3, omega-6) and monounsaturated fats lower LDL. Dietary cholesterol has a smaller effect than once thought. Soluble fibre also lowers LDL. Not all fats equally increase CVD risk. [1+1]
Q5.1, Iron deficiency explanation (2 marks)
Although kangaroo meat provides haem iron (well-absorbed), the high-carbohydrate diet of white rice and processed foods may be low in vitamin C (needed to enhance non-haem iron absorption) [1 mark]. More significantly, if fresh fruit and vegetables (major vitamin C sources) are absent from the diet, any non-haem iron consumed (from plant-based components) will be absorbed very poorly, and the overall dietary pattern lacks the variety to consistently meet iron requirements, particularly for women with menstrual losses [1 mark].
Q5.2, Vitamin D deficiency despite outdoor work (2 marks)
Two reasons: (1) Individuals with darker skin (higher melanin content) have reduced UVB-mediated vitamin D synthesis for a given amount of sun exposure, melanin competes with 7-dehydrocholesterol for UVB absorption [1 mark]. (2) In the tropical Northern Territory, UVB radiation is intense but midday sun exposure may be avoided due to extreme heat, and if workers cover skin for protection from heat or cultural reasons, effective UVB exposure is reduced despite being “outdoors” [1 mark].
Q5.3, Why supplements alone are insufficient for T2D (1 mark)
Type 2 diabetes is driven by dietary excess of refined carbohydrates and saturated fat (a macronutrient overload problem), not by micronutrient deficiency. Vitamin supplements address deficiencies but cannot prevent or treat the chronic metabolic overload caused by a high-sugar, high-fat processed food diet, the root cause of insulin resistance in this community. Dietary change, reducing refined carbohydrate and saturated fat intake, and increasing physical activity are the primary preventive strategies for T2D.