Biology • Year 12 • Module 8 • Lesson 8
Environmental Diseases, Smoking, UV Exposure, Asbestos and Lifestyle Factors
Apply the dose-response principle, the mechanism of each exposure and the epigenetics framework to real Australian epidemiological data and case scenarios.
1. Interpret Australian lung cancer mortality data
The graph below shows age-standardised lung cancer mortality rates for Australian males and females from 1975 to 2020. Male smoking rates peaked around 1945 and have since declined steeply; female smoking rates peaked later (around 1975) and declined more gradually. 8 marks
Figure 1.1. Adapted from AIHW (2022) Cancer in Australia 2022, age-standardised rates.
1.1 Describe the trend in male lung cancer mortality from 1975 to 2020 and estimate the approximate peak rate and year. 2 marks
1.2 Male smoking rates peaked around 1945 but male lung cancer mortality peaked in approximately 1985–1990. Using the concept of latency period, explain this delay. 2 marks
1.3 The female lung cancer mortality rate rose gradually from 1975 and appears to plateau after 2005, unlike the male rate which has declined more sharply. Suggest two reasons for this difference between the male and female patterns. 2 marks
1.4 A student claims: “This graph proves that smoking directly causes lung cancer in a 1:1 relationship.” Evaluate this claim using the concepts of dose-response relationship and multifactorial disease. 2 marks
2. Trace the cause-and-effect chain, asbestos to mesothelioma
The left column shows causes (filled in for you). The right column shows effects, complete each one. Then write the overall outcome. 6 marks (1 per effect + 1 overall)
| Cause | Effect (complete this) |
|---|---|
| Asbestos fibres are inhaled and lodge in the pleural lining | |
| Alveolar macrophages attempt to engulf the long fibres but cannot completely degrade them (frustrated phagocytosis) | |
| Reactive oxygen species (ROS) are released by the frustrated macrophages into the surrounding tissue | |
| Mesothelial cells accumulate DNA damage over 20–50 years; key tumour suppressor genes (BAP1, NF2, CDKN2A) are mutated | |
| Cell cycle regulation breaks down in affected mesothelial cells |
Overall outcome (so…):
3. Interpret occupational asbestos + smoking interaction data
The table below shows relative lung cancer risk for four groups compared to a non-smoking, non-asbestos baseline. 6 marks
| Group | Asbestos exposure | Smoker? | Relative lung cancer risk (vs baseline) |
|---|---|---|---|
| 1 | No | No | 1× (baseline) |
| 2 | Yes (occupational) | No | ~5× |
| 3 | No | Yes (heavy) | ~10× |
| 4 | Yes (occupational) | Yes (heavy) | ~50–90× |
Data adapted from Markowitz et al. (2013) Chest 143(1): 106–114.
3.1 If the two exposures were simply additive, what relative risk would you predict for Group 4? Compare this to the observed value and classify the interaction. 2 marks
3.2 Suggest two biological reasons why asbestos and smoking together produce a risk far greater than the sum of their individual effects. 2 marks
3.3 What does the dose-response relationship predict about an asbestos worker who also smokes more cigarettes per day? Use the data to support your answer. 2 marks
4. Apply to a case, Wittenoom, Western Australia
Wittenoom was a Western Australian mining town that produced crocidolite (‘blue’) asbestos from 1943 to 1966. Over 7,000 workers and family members were exposed to asbestos dust. Australia banned asbestos use in 2003. As of 2022, Wittenoom residents and former workers continue to be diagnosed with mesothelioma at elevated rates, even though the mine closed 56 years ago. 5 marks
4.1 Explain why mesothelioma cases from Wittenoom are still being diagnosed in 2022, more than 56 years after the mine closed. Use the concepts of latency period and biopersistence. 3 marks
4.2 Predict whether the rate of new mesothelioma diagnoses among Wittenoom-exposed individuals will increase, remain stable, or decline over the next 20 years. Justify your prediction using the dose-response relationship and what you know about asbestos latency. 2 marks
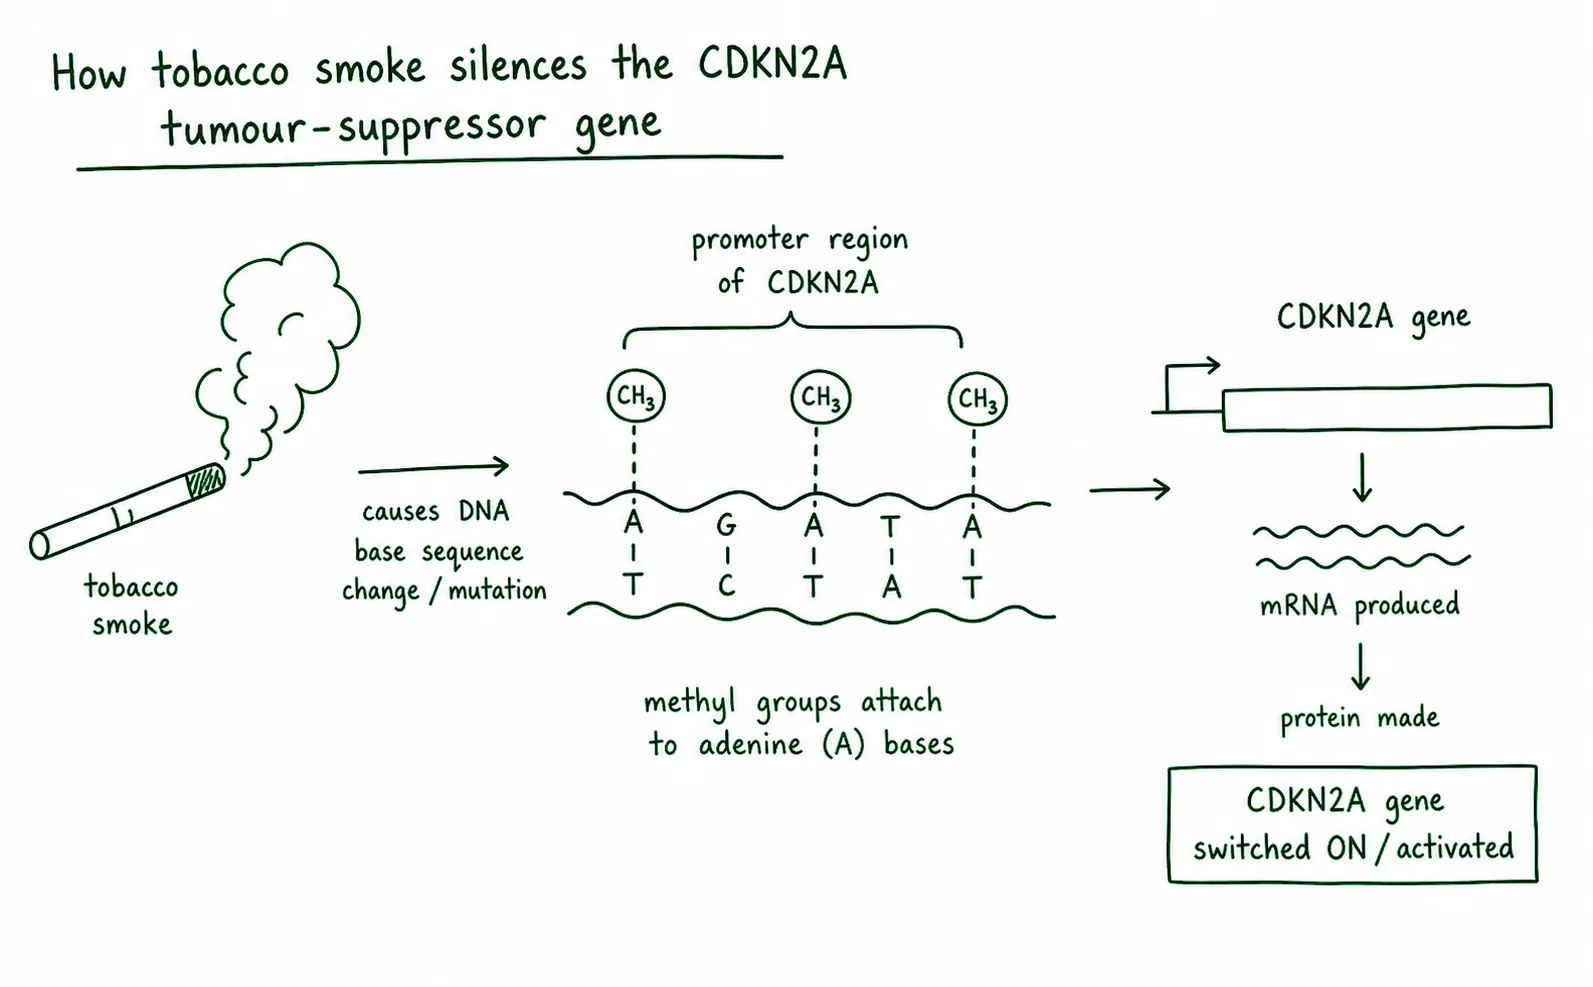
5. Diagram critique, spot the errors in this student’s epigenetics explanation
A student drew the diagram below to explain how tobacco smoke silences the CDKN2A tumour suppressor gene. There are three biological errors. Identify each error and write the correction. 6 marks: 2 per error (1 identify + 1 correct)
5.1 Error 1: What is wrong?
Correction:
5.2 Error 2: What is wrong?
Correction:
5.3 Error 3: What is wrong?
Correction:
Q1.1, Trend description
Male lung cancer mortality rose from approximately 55 per 100,000 in 1975, peaked at approximately 75–80 per 100,000 around 1985–1990, and has since declined to approximately 42 per 100,000 by 2020. The overall trend is an inverted-U (rise then sustained decline). Accept any plausible peak estimate of 70–82 in the 1985–1992 period. [2 marks: 1 for describing rise-then-fall, 1 for plausible peak estimate with year]
Q1.2, Latency period explanation
Lung cancer has a latency period of 20–30 years between initial exposure and clinical disease. Male smoking peaked around 1945, so the cohort of men who smoked most heavily in the 1940s and 1950s began to develop lung cancer in the 1960s–1970s, with the mortality peak occurring 35–45 years after peak smoking prevalence [1]. This latency reflects the time needed for multiple tobacco carcinogen-induced mutations to accumulate in a single bronchial cell line to produce invasive lung cancer [1].
Q1.3, Male vs female pattern
Accept any two of: (i) Female smoking rates peaked approximately 30 years later than male rates (around 1975 vs 1945), so the female lung cancer mortality curve lags the male curve by approximately 30 years, meaning the plateau in female rates around 2005 reflects female smoking patterns from the 1970s–1980s, and the decline has not yet been as steep because the time since peak is shorter [1]. (ii) Continued moderate smoking rates among women have maintained exposure levels, preventing the sharp decline seen in men whose rates fell earlier and more steeply [1]. (iii) Improvements in treatment (surgical resection, targeted therapies, immunotherapy) have modestly improved survival, which somewhat decouples mortality trends from incidence [1].
Q1.4, Evaluate the 1:1 claim
The claim overstates the relationship. The dose-response relationship shows that lung cancer risk increases with cumulative tobacco exposure (measured in pack-years), more smoking = higher risk, not a guaranteed outcome. Lung cancer is a multifactorial disease: not every heavy smoker develops lung cancer, and approximately 15% of lung cancers occur in non-smokers. Genetic susceptibility (e.g. DNA repair enzyme efficiency), other environmental exposures (radon, air pollution), and random variation in which cells accumulate sufficient mutations all modify the individual outcome. [2 marks: 1 for correctly applying dose-response to reject 1:1; 1 for multifactorial / probabilistic reasoning]
Q2, Cause-and-effect chain
Row 1 effect: Macrophages are recruited to attempt to phagocytose and clear the foreign fibres.
Row 2 effect: The macrophages release reactive oxygen species (ROS) and inflammatory cytokines in a chronic, unsuccessful attempt to degrade the indestructible fibres (frustrated phagocytosis).
Row 3 effect: ROS directly damage the DNA of neighbouring mesothelial cells, causing strand breaks and oxidative base modifications.
Row 4 effect: Loss of tumour suppressor function removes cell cycle checkpoints; the affected mesothelial cells can now divide without normal regulation.
Row 5 effect: Uncontrolled mesothelial cell division produces a tumour mass in the pleural lining.
Overall outcome: Malignant mesothelioma develops, typically 20–50 years after initial asbestos exposure, due to the cumulative physical (not chemical) carcinogenic effect of persistent asbestos fibres on mesothelial cells.
Q3.1, Additive prediction vs observed
Additive prediction for Group 4: asbestos alone (5×) + smoking alone (10×) = 15× baseline. Observed: 50–90× baseline. Because the observed risk (50–90×) is far greater than the additive prediction (15×), the interaction is classified as synergistic (supra-additive). [1 mark for correct additive calculation of ~15×; 1 mark for classifying as synergistic]
Q3.2, Biological reasons for synergy
Accept any two of: (i) Asbestos fibres impair mucociliary clearance of the airways, increasing the residence time of tobacco carcinogens in bronchial tissue, effectively increasing the tobacco dose [1]. (ii) Both exposures converge on the same oncogenic pathway in bronchial epithelial cells: asbestos-driven ROS damages DNA in the same cells that tobacco carcinogens also target, creating a combined mutational load on the same cell population [1]. (iii) Asbestos-driven chronic inflammation creates a pro-proliferative and pro-mutagenic microenvironment (more cell division = more opportunities for tobacco-induced mutations to be replicated and propagated) [1].
Q3.3, Dose-response prediction
The dose-response relationship predicts that an asbestos worker who smokes more cigarettes per day will have a higher cumulative carcinogen exposure, which increases the probability that sufficient mutations accumulate in a bronchial cell to produce lung cancer. The data support this: Group 4 (asbestos + heavy smoking) already shows 50–90× the baseline risk; heavier smoking further increases the mutational load from tobacco carcinogens, pushing risk even higher. [2 marks: 1 for applying dose-response reasoning; 1 for connecting to the data]
Q4.1, Wittenoom latency explanation
Asbestos fibres are biopersistent, they are chemically inert and cannot be degraded by the body. Once inhaled, they remain lodged in the pleural lining indefinitely [1]. Asbestos-related mesothelioma has a latency period of 20–50 years from first exposure to clinical diagnosis [1]. Workers exposed in 1966 (when the mine closed) would enter the 20–50 year latency window between 1986 and 2016. Many individuals exposed between 1943 and 1966 are only now reaching the upper end of this window (2016–2022+), so new diagnoses continue to emerge decades after exposure ceased [1].
Q4.2, Prediction for next 20 years
The rate of new diagnoses among directly exposed Wittenoom workers and residents is likely to decline over the next 20 years. The original exposure cohort is ageing and decreasing in size, and no new asbestos exposure is occurring since 2003 [1]. The dose-response relationship and latency window predict that as the 50-year upper latency limit is exceeded for those exposed in the earliest period (1943), the pool of individuals still within the at-risk latency window will shrink. However, some cases may continue to emerge from individuals who were exposed to low-level contamination in the surrounding area (e.g. from disturbed building materials), sustaining a small number of cases beyond the primary cohort [1].
Q5, Epigenetics diagram critique
5.1 Error 1 The diagram labels the process as “DNA mutation.” This is wrong: DNA methylation by tobacco smoke is an epigenetic change, not a mutation. The DNA nucleotide sequence of CDKN2A is not altered, a methyl group is added to cytosine, but the cytosine nucleotide remains in place. Correction: relabel the process as “DNA methylation (epigenetic change)” and note that the nucleotide sequence is unchanged.
5.2 Error 2 Methyl groups are shown attaching to adenine (A) bases. This is wrong: DNA methylation in the context of gene silencing occurs at cytosine (C) bases within CpG dinucleotide sites. Correction: redraw methyl groups attaching to cytosine (C) bases in the CpG sites of the promoter region.
5.3 Error 3 The result is labelled “CDKN2A gene is activated.” This is wrong: methylation of the CDKN2A promoter silences the gene by preventing transcription factor binding. Correction: change the label to “CDKN2A gene is silenced / transcription repressed” and add that p16 protein is not produced, removing a cell cycle checkpoint.