Biology • Year 12 • Module 8 • Lesson 4
Water Balance, Neural and Hormonal Coordination
Apply ADH and aldosterone pathways to real urine data, a cause-and-effect chain, a diagram critique, and a physiological prediction scenario.
1. Interpret plasma ADH concentration and urine osmolarity data
The graph below shows data collected from a healthy adult volunteer. At time 0 the subject began a 4-hour period of water deprivation. Plasma ADH concentration (pmol/L) and urine osmolarity (mOsm/kg) were measured every 30 minutes. 9 marks
Figure 1.1. Plasma ADH concentration and urine osmolarity during 4 hours of water deprivation in a healthy adult volunteer. Data values representative of those reported in Robertson & Berl (1996) in The Kidney, 5th ed.
1.1 Describe the trend in plasma ADH concentration from time 0 to 240 minutes, including a specific figure from the graph. 2 marks
1.2 Describe the relationship between plasma ADH concentration and urine osmolarity across the 4-hour period. 2 marks
1.3 Using the ADH pathway from Card 2, explain the mechanism by which rising plasma ADH concentration produces the urine osmolarity trend shown. 3 marks
1.4 Predict what would happen to both curves if the volunteer drank 750 mL of water at t = 240 minutes. Justify your prediction using the negative feedback mechanism. 2 marks
2. Cause-and-effect chain, blood loss and the RAAS pathway
A cyclist in the 2023 Tour de France crashes and loses significant blood. Complete the cause-and-effect chain below by filling each empty box with the next step in the aldosterone (RAAS) pathway. The first cause and final outcome are given. 6 marks
Step 1: Which specialised cells in the kidney detect the fall in blood pressure?
Step 2: What enzyme do these cells release, and what does it begin to convert?
Step 3: Name the active hormone that results from the RAAS cascade and identify the gland it stimulates.
Step 4: Name the hormone released and identify where in the nephron it acts.
Step 5: What is the direct effect of this hormone on solute reabsorption in the nephron?
Step 6: Why does water follow the solute reabsorbed in Step 5? Name the process.
3. Diagram critique, spot the three biological errors
A Year 12 student drew the diagram below to show “how ADH and aldosterone maintain water balance”. There are three biological errors. Identify each error and write the correction. 6 marks: 2 per error, 1 identify, 1 correct
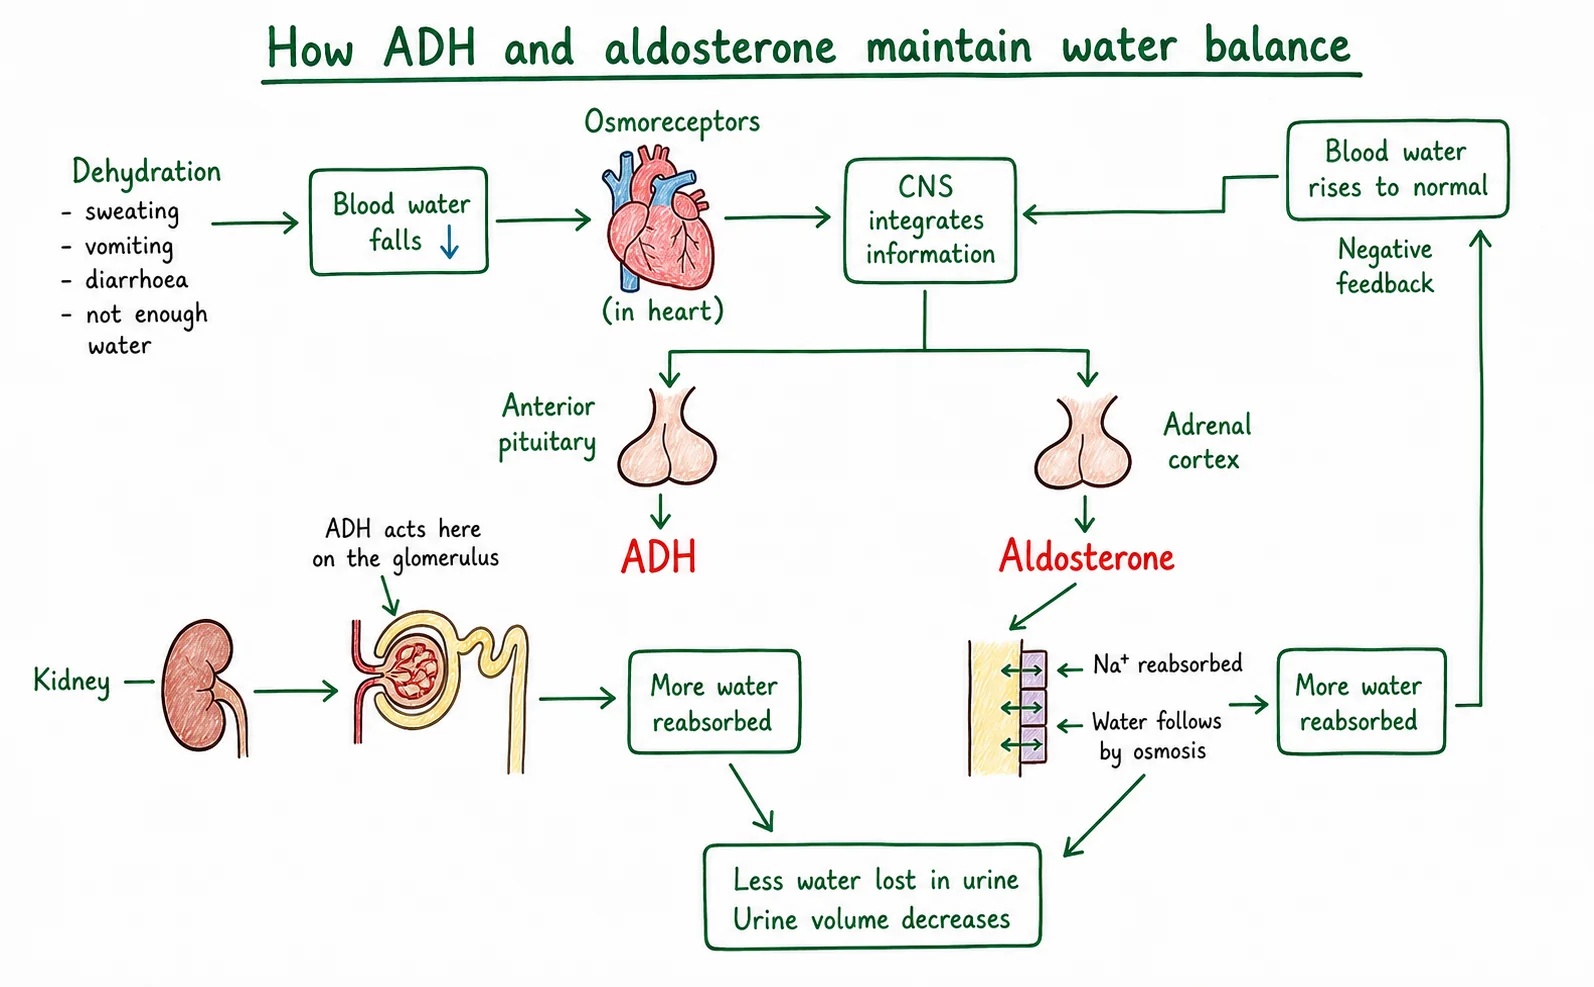
3.1 Error 1: What is wrong?
Correction:
3.2 Error 2: What is wrong?
Correction:
3.3 Error 3: What is wrong?
Correction:
4. Predict and justify, ACE inhibitor pharmacology
A 58-year-old woman with hypertension is prescribed ramipril, an ACE inhibitor that blocks the conversion of angiotensin I to angiotensin II. Using your knowledge of the RAAS pathway, predict and justify the effect of this drug on each of the following: 6 marks
4.1 Aldosterone levels in her blood. 2 marks
4.2 Na&sup+; reabsorption in the distal convoluted tubule. 2 marks
4.3 Blood pressure after several weeks of treatment. 2 marks
Q1.1, Trend in plasma ADH (2 marks)
Plasma ADH concentration increases progressively throughout the 4-hour period of water deprivation. It rises from approximately 2 pmol/L at t = 0 to approximately 19 pmol/L at t = 240 minutes [1 mark for identifying steady rise; 1 mark for quoting at least one specific value from the graph, accept values within reasonable reading range].
Q1.2, Relationship between ADH and urine osmolarity (2 marks)
There is a positive relationship between plasma ADH concentration and urine osmolarity: as ADH rises over time, urine osmolarity also rises progressively (from approximately 290 mOsm/kg to approximately 940 mOsm/kg) [1 mark for identifying the positive / direct relationship; 1 mark for stating that both increase over the same time period or for using the term “positive correlation”].
Q1.3, Mechanism (3 marks)
As water deprivation continues, blood osmolarity rises above the set point (~295 mOsm/kg), causing osmoreceptors in the hypothalamus to shrink and send stronger nerve signals to the posterior pituitary [1]. This increases ADH release into the bloodstream; ADH travels to the kidneys and causes aquaporin water channel proteins to be inserted into the collecting duct membrane [1]. The higher the ADH concentration, the more aquaporins are inserted, the more permeable the collecting duct becomes to water, the more water is reabsorbed from the filtrate into the blood, and the more concentrated (higher osmolarity) the remaining urine becomes [1].
Q1.4, Prediction after drinking 750 mL (2 marks)
Plasma ADH concentration would fall (the curve would turn downward) and urine osmolarity would decrease [1]. Drinking 750 mL of water would dilute the blood, lowering blood osmolarity below the set point; osmoreceptors detect the fall and reduce ADH secretion; with less ADH, aquaporins are removed from the collecting duct membrane, making it less permeable to water; less water is reabsorbed; urine becomes more dilute (lower osmolarity), restoring blood osmolarity to normal (negative feedback) [1].
Q2, Cause-and-effect chain model answers (6 marks)
Step 1: Juxtaglomerular cells (in the wall of the afferent arteriole of the kidney) detect the fall in blood pressure.
Step 2: They release the enzyme renin, which converts angiotensinogen (a liver protein) to angiotensin I.
Step 3: ACE (in the lungs) converts angiotensin I to angiotensin II, which stimulates the adrenal cortex (gland on top of the kidney).
Step 4: The adrenal cortex secretes aldosterone; it acts on the distal convoluted tubule (DCT).
Step 5: Aldosterone increases Na&sup+; (sodium) reabsorption from the filtrate back into the blood by upregulating Na&sup+; channels and Na&sup+;/K&sup+;-ATPase pumps in the DCT cells.
Step 6: Water follows the reabsorbed Na&sup+; by osmosis as Na&sup+; is moved from filtrate to blood, the blood becomes more concentrated (higher solute) than the filtrate, so water moves down its concentration gradient (by osmosis) from the filtrate into the blood.
Q3, Diagram critique (6 marks)
3.1 Error 1: The diagram states osmoreceptors are located in the anterior pituitary. Correction: osmoreceptors are located in the hypothalamus. They detect changes in blood osmolarity by shrinking or swelling in response to changes in surrounding fluid concentration. [1 + 1]
3.2 Error 2: The diagram states ADH is released from the anterior pituitary. Correction: ADH is released from the posterior pituitary gland. ADH is synthesised in the hypothalamus but stored in and released from the posterior pituitary in response to nerve signals from the hypothalamus. [1 + 1]
3.3 Error 3: The diagram states ADH acts on the distal tubule (DCT). Correction: ADH acts on the collecting duct. It is aldosterone (not ADH) that acts on the DCT. ADH acts by inserting aquaporin channels into the collecting duct membrane. [1 + 1]
Q4, Predict and justify: ACE inhibitor (6 marks)
4.1 Aldosterone levels will fall. ACE inhibitors block the conversion of angiotensin I to angiotensin II. Angiotensin II is the signal that stimulates the adrenal cortex to release aldosterone. Without angiotensin II, the adrenal cortex is not stimulated, so aldosterone secretion decreases. [1 mark predict; 1 mark mechanism]
4.2 Na&sup+; reabsorption in the DCT will decrease. Aldosterone normally drives Na&sup+; transport proteins in the DCT cells; with lower aldosterone, these channels are not upregulated and less Na&sup+; is reabsorbed from the filtrate into the blood. [1 mark predict; 1 mark mechanism]
4.3 Blood pressure will fall toward normal. With less Na&sup+; reabsorption in the DCT, the osmotic gradient that draws water into the blood by osmosis is reduced. Less water is reabsorbed, blood volume decreases, and blood pressure falls. This is exactly why ACE inhibitors (e.g. ramipril) are prescribed for hypertension, they reduce blood volume and pressure by interrupting the RAAS cascade. [1 mark predict; 1 mark mechanism]