Biology • Year 12 • Module 8 • Lesson 1
Homeostasis, Stimulus-Response, Feedback Loops and the Internal Environment
Apply the stimulus-response model and feedback distinctions to real blood glucose data, a new homeostatic scenario, and a diagram critique.
1. Interpret blood glucose data, negative feedback in action
The graph below shows blood glucose concentration (mmol/L) measured in a healthy adult over an 8-hour period including breakfast (8 am), lunch (1 pm), and 30 minutes of moderate exercise (3:30–4 pm). Data are representative of values reported in continuous glucose monitoring studies in healthy non-diabetic Australian adults. 9 marks
Representative continuous glucose monitoring data from a healthy non-diabetic adult. Adapted from Freckmann et al. (2011), Journal of Diabetes Science and Technology 5(1):111–121.
1.1 Identify the peak blood glucose value after breakfast and the time it was reached. State whether this value is inside or outside the normal tolerance range (4.0–6.0 mmol/L). 2 marks
1.2 Using the stimulus-response model, explain the process by which blood glucose is returned to the normal range after the post-breakfast peak. Name all five components of the pathway in your answer. 5 marks
1.3 During exercise (3:30–4 pm) blood glucose falls to 4.3 mmol/L. Explain which hormone corrects this and identify the type of feedback operating. 2 marks
2. Sequence the steps, ADH and water balance
The events below describe the homeostatic response to dehydration. They are listed in a shuffled order. Write the correct sequence number (1–8) in the Order column. 8 marks
| Order | Event |
|---|---|
| Posterior pituitary gland releases ADH (antidiuretic hormone) into the bloodstream. | |
| A person exercises on a hot day without adequate fluid intake, water is lost through sweating. | |
| The collecting duct in the kidney becomes more permeable to water. | |
| Blood osmolarity falls back toward the normal set point (~285–295 mOsm/kg). | |
| Osmoreceptors in the hypothalamus detect the rise in blood osmolarity above ~295 mOsm/kg. | |
| The hypothalamus (control centre) integrates the signal and sends instructions to the posterior pituitary. | |
| Blood osmolarity rises above the upper tolerance limit as plasma water content decreases. | |
| Water is reabsorbed from the renal filtrate back into the blood; urine becomes more concentrated. |
3. Cause-and-effect chain, what happens when homeostasis fails?
The cause boxes (left column) are filled in. Complete the effect boxes (right column). The final row asks for the overall disease/disorder outcome. 5 marks
Context: A person with Type 1 diabetes has no functioning beta cells and cannot produce insulin. Consider what happens after they eat a carbohydrate-rich meal.
| Cause | Effect (complete this) |
|---|---|
| Carbohydrates are digested; glucose enters the bloodstream, blood glucose rises above 6 mmol/L. | |
| Beta cells cannot produce insulin because they have been destroyed by the immune system. | |
| Without insulin, body cells (muscle, adipose, liver) do not increase glucose uptake from the blood. | |
| Chronically elevated blood glucose (hyperglycaemia) exerts osmotic pressure on blood vessel walls. | |
| Overall outcome (so…): | |
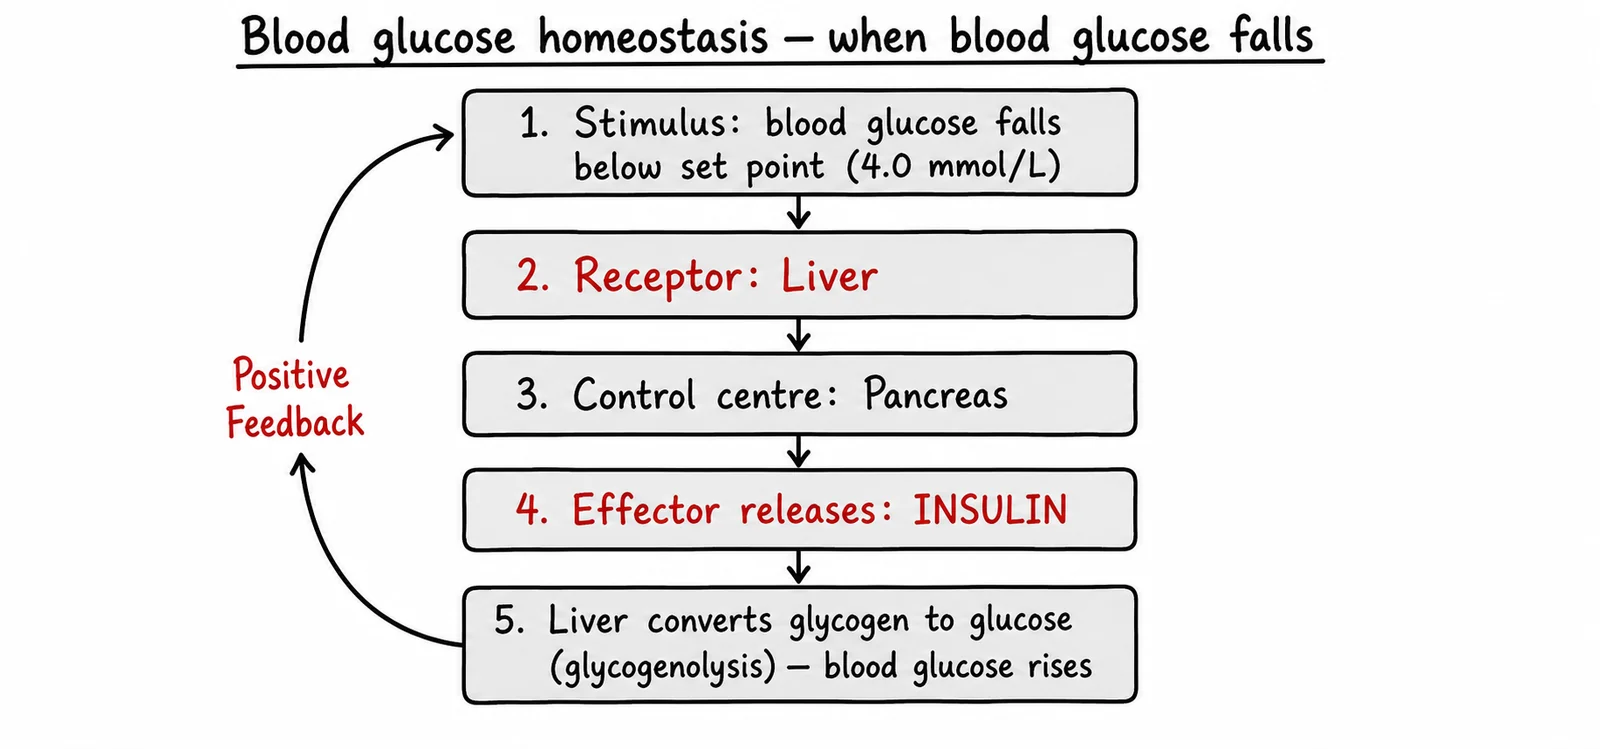
4. Diagram critique, what’s wrong with this student’s description?
A Year 12 student wrote the following description of the homeostatic response to a fall in blood glucose. There are three biological errors. Identify each error and write the correction. 6 marks, 2 per error: 1 identify, 1 correct
4.1 Error 1: What is wrong?
Correction:
4.2 Error 2: What is wrong?
Correction:
4.3 Error 3: What is wrong?
Correction:
Q1.1, Peak glucose and tolerance range
Peak blood glucose after breakfast: approximately 7.8 mmol/L reached at approximately 8:45 am. This value is outside the normal tolerance range of 4.0–6.0 mmol/L (it exceeds the upper limit of 6.0 mmol/L). [1 mark for peak value + time; 1 mark for correctly identifying it is outside the tolerance range.]
Q1.2, Five-component stimulus-response pathway (5 marks)
Stimulus: Blood glucose rising above the normal tolerance range (~6.0 mmol/L) after a meal [1]. Receptor: Beta cells in the islets of Langerhans in the pancreas detect the elevated blood glucose [1]. Control centre: The beta cells (which function as both receptor and control centre in this system) process the signal [1]. Effector: The beta cells themselves release insulin into the bloodstream; the liver and body cells act as effectors by responding to insulin [1]. Response: Insulin triggers glucose uptake by muscle, adipose and liver cells; the liver converts excess glucose to glycogen (glycogenesis); blood glucose falls back toward the set point of ~5 mmol/L [1]. This is negative feedback, the response opposes the original rise in blood glucose.
Q1.3, Exercise dip correction (2 marks)
Glucagon corrects the exercise-induced fall in blood glucose [1]. Alpha cells in the islets of Langerhans detect the low blood glucose and release glucagon, which stimulates the liver to convert glycogen to glucose (glycogenolysis), raising blood glucose back toward the set point. This is negative feedback the response (rising blood glucose) opposes the stimulus (falling blood glucose) [1].
Q2, Correct sequence for ADH/water balance
Correct order:
- A person exercises on a hot day without adequate fluid intake, water is lost through sweating.
- Blood osmolarity rises above the upper tolerance limit as plasma water content decreases.
- Osmoreceptors in the hypothalamus detect the rise in blood osmolarity above ~295 mOsm/kg.
- The hypothalamus (control centre) integrates the signal and sends instructions to the posterior pituitary.
- Posterior pituitary gland releases ADH (antidiuretic hormone) into the bloodstream.
- The collecting duct in the kidney becomes more permeable to water.
- Water is reabsorbed from the renal filtrate back into the blood; urine becomes more concentrated.
- Blood osmolarity falls back toward the normal set point (~285–295 mOsm/kg).
Q3, Cause-and-effect chain (Type 1 diabetes)
Row 1 effect: The normal homeostatic stimulus is present (blood glucose above tolerance range), but the corrective response cannot occur because insulin is absent.
Row 2 effect: The negative feedback loop for reducing blood glucose is broken, the effector (insulin) cannot be produced, so blood glucose remains elevated above the tolerance range.
Row 3 effect: Blood glucose remains chronically elevated (hyperglycaemia) because the cells cannot remove glucose from circulation without insulin signalling.
Row 4 effect: Damage to small and large blood vessel walls occurs progressively; blood vessel integrity is compromised, reducing oxygen and nutrient delivery to tissues.
Overall outcome: Without medical management (exogenous insulin), Type 1 diabetes leads to chronic hyperglycaemia causing progressive damage to the kidneys, retinas, peripheral nerves, and cardiovascular system, demonstrating how a broken negative feedback loop leads to disease.
Q4, Diagram critique (6 marks)
4.1 Error 1, Receptor labelled “liver”: The liver is an effector in glucose regulation, not a receptor. Correction: the receptor is the alpha cells in the islets of Langerhans in the pancreas, which detect falling blood glucose and initiate the corrective response. [1 + 1]
4.2 Error 2, Hormone labelled “insulin”: Insulin is released when blood glucose is high and lowers blood glucose. When blood glucose falls, it is glucagon that is released by the alpha cells. Glucagon stimulates the liver to convert glycogen to glucose (glycogenolysis), raising blood glucose back toward the set point. [1 + 1]
4.3 Error 3, Feedback type labelled “positive feedback”: The blood glucose correction loop is negative feedback, not positive feedback. The response (glucagon → glycogenolysis → rising blood glucose) opposes the original stimulus (falling blood glucose), returning the variable toward its set point. Positive feedback would amplify the fall, driving blood glucose further down, which is not what occurs. [1 + 1]