Biology • Year 12 • Module 7 • Lesson 10
The Innate Immune System
Apply phagocytosis, NK cell function and innate-adaptive coordination to real neutrophil data, a viral evasion scenario and a cause-and-effect chain.
1. Interpret data — neutrophil response to Staphylococcus aureus infection
The graph below shows neutrophil counts in blood and at the infection site (peritoneal lavage) over 24 hours following injection of Staphylococcus aureus into mice (after Kolaczkowska & Kubes 2013, Nature Reviews Immunology). 8 marks
1.1 Describe the trend in blood neutrophil count between 0 and 24 hours. Use specific values from the graph in your answer. 2 marks
1.2 The blood neutrophil count drops sharply at 2–4 hours. Using lesson content, explain why this occurs. Name the process by which neutrophils exit blood vessels. 3 marks
1.3 The infection-site neutrophil count peaks at approximately 4–6 hours and then declines. Suggest two reasons for this decline. 2 marks
1.4 Blood neutrophil count has largely recovered by 12–24 hours. What does this recovery suggest about the bone marrow's response to infection? 1 mark
2. Cause-and-effect chain — splinter triggers the innate cascade
A splinter carrying Staphylococcus epidermidis bacteria punctures a fingertip. Complete the cause-and-effect chain below by filling in the effect for each cause. The last row asks for the final outcome for the bacterium. 6 marks
| Cause / event | Effect — write your answer |
|---|---|
| 2.1 Bacterial PAMPs contact PRRs on mast cells at the wound site. | |
| 2.2 Histamine is released from mast cells into surrounding tissue. | |
| 2.3 Complement proteins in leaked plasma contact bacterial surface molecules. | |
| 2.4 Chemokines form a concentration gradient from the wound to nearby capillaries. | |
| 2.5 A neutrophil's PRRs bind to PAMPs on an opsonised bacterium at the wound site. | |
| 2.6 A lysosome fuses with the phagosome inside the neutrophil. |
3. Predict and justify — viral evasion of immune detection
Some viruses (including herpes simplex virus) have evolved proteins that downregulate MHC class I expression on infected cells — they reduce the number of MHC I molecules displayed on the infected cell's surface. This strategy helps the virus hide from cytotoxic T cells. 6 marks
3.1 Explain why reducing MHC class I expression would normally help a virus hide from cytotoxic T cells. 2 marks
3.2 Predict how the innate immune system would respond to these MHC-I-downregulated infected cells. Name the specific cell type involved and the mechanism it uses. 2 marks
3.3 A student claims that "a virus that hides from T cells will be safe from the entire immune system." Evaluate this claim using lesson content. 2 marks
4. Diagram critique — spot the errors in this student's phagocytosis diagram
A Year 12 student has produced the diagram below to show the steps of phagocytosis. There are three biological errors in the diagram. Identify each error and write the correction. 6 marks — 2 per error: 1 identify, 1 correct
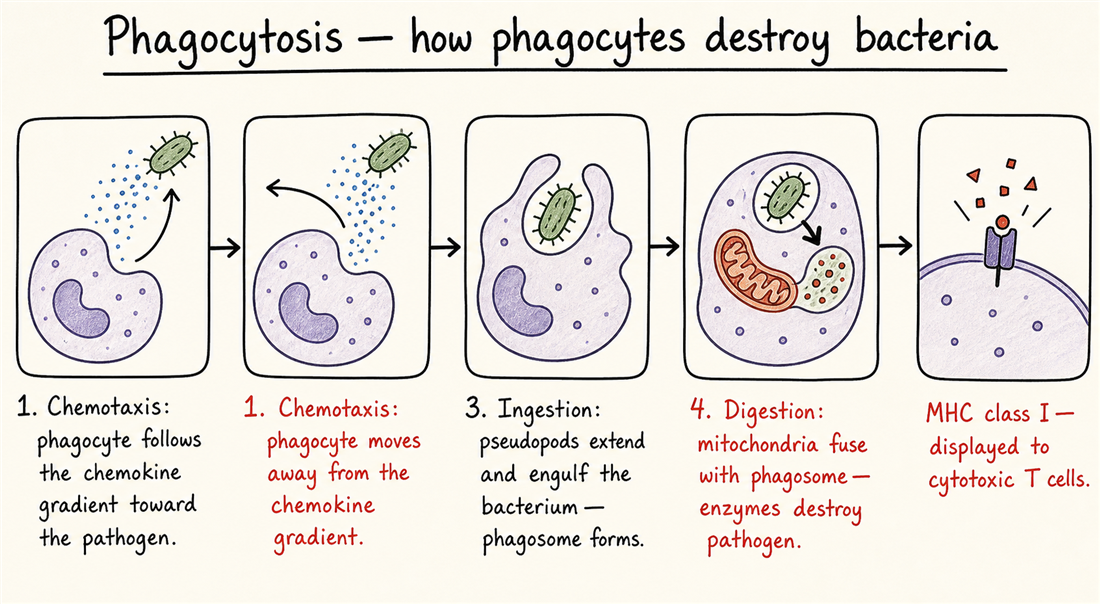
4.1 Error 1: What is wrong?
Correction:
4.2 Error 2: What is wrong?
Correction:
4.3 Error 3: What is wrong?
Correction:
Q1.1 — Trend in blood neutrophil count
Blood neutrophil count starts at approximately 9 × 10⁶ cells/mL at 0 hours and remains close to this at 2 hours, then drops sharply to approximately 2 × 10⁶ cells/mL at 4 hours. After this low point, it begins to recover, reaching approximately 7–8 × 10⁶ cells/mL by 12 hours and stabilising through to 24 hours [1 for direction/shape, 1 for specific values from the graph].
Q1.2 — Why blood neutrophil count drops (3 marks)
When bacteria enter the tissue, mast cells detect PAMPs and release histamine, which dilates blood vessels and increases capillary permeability [1]. Complement proteins are activated and release chemokines that form a concentration gradient from the wound to the capillaries [1]. Neutrophils in the blood respond to this signal and undergo diapedesis — the process by which they squeeze through capillary walls — migrating to the infection site along the chemokine gradient [1]. This mass exodus of neutrophils from the blood is what causes the sharp drop in blood neutrophil count.
Q1.3 — Why infection-site count declines after 4–6 hours
Neutrophils are short-lived cells that die within hours to days after phagocytosing pathogens [1]. As the bacterial load is reduced through phagocytosis, fewer chemokine signals are produced, so fewer new neutrophils are recruited to the site [1]. Accept also: formation of pus (dead neutrophils and debris) which is removed from the site.
Q1.4 — What blood neutrophil recovery suggests
The recovery suggests that the bone marrow has ramped up neutrophil production (a process called myelopoiesis) in response to infection-signalling cytokines (such as G-CSF), releasing new neutrophils into the bloodstream to replenish those lost to diapedesis [1].
Q2 — Cause-and-effect chain answers
2.1 Mast cells are activated and degranulate, releasing histamine (and other chemical mediators) into the surrounding tissue. 2.2 Histamine causes local blood vessels to dilate (vasodilation) and capillary walls to become more permeable — producing redness, warmth and swelling; plasma leaks into the tissue. 2.3 Complement proteins are activated on the bacterial surface, coating the bacteria (opsonisation), releasing chemokines that attract phagocytes, and potentially forming a membrane attack complex that directly damages bacterial membranes. 2.4 Neutrophils in nearby capillaries detect the chemokine gradient and migrate along it (chemotaxis) toward the wound by diapedesis through capillary walls. 2.5 The neutrophil extends pseudopods around the opsonised bacterium and engulfs it, forming a phagosome. 2.6 A phagolysosome forms; lysosomal digestive enzymes and reactive oxygen species destroy the bacterium.
Q3.1 — Why low MHC I hides the virus from T cells
Cytotoxic T cells recognise and kill infected cells by detecting a specific foreign antigen displayed on MHC class I molecules. If MHC I expression is reduced, the infected cell cannot present viral antigens to T cells, so the T cell has no signal to trigger an attack — the infected cell is effectively invisible to cytotoxic T cells [1 for mechanism, 1 for linking to invisible/no signal].
Q3.2 — Innate response to MHC-I-downregulated cells
Natural killer (NK) cells [1] would recognise and kill these infected cells. NK cells use a "missing self" strategy: they continuously check for MHC class I on host cells, and any cell with reduced or absent MHC I is flagged for destruction. NK cells release perforin and granzymes to kill the target cell [1].
Q3.3 — Evaluate the student's claim
The claim is incorrect [1]. While downregulating MHC I does conceal the infected cell from cytotoxic T cells (adaptive system), it simultaneously makes the cell more visible to NK cells of the innate immune system. NK cells evolved specifically to detect the "missing self" signal — the very act of hiding from T cells triggers NK cell killing. A virus cannot simultaneously maintain high MHC I (visible to NK cells, but can display antigens) and low MHC I (hidden from T cells, but targeted by NK cells) [1].
Q4 — Diagram critique answers
4.1 Error 1: The label "phagocyte moves away from chemokine gradient" is wrong. Correction: Phagocytes move toward the chemokine gradient (chemotaxis is directed movement toward higher chemical concentration). [1 + 1]
4.2 Error 2: The organelle in step 4 is labelled "mitochondria." Correction: The organelle that fuses with the phagosome is a lysosome — an organelle containing digestive enzymes and reactive oxygen species. The fused structure is the phagolysosome. Mitochondria are energy-producing organelles unrelated to pathogen digestion. [1 + 1]
4.3 Error 3: Antigen fragments are shown displayed on MHC class I in step 5. Correction: After phagocytosis, macrophages and dendritic cells present antigen fragments on MHC class II (not MHC I) to activate T helper cells. MHC class I is used by all nucleated body cells to display their internal proteins, and is read by NK cells and cytotoxic T cells. [1 + 1]