Biology • Year 12 • Module 7 • Lesson 5
Microbial Testing
Apply the serial dilution and plate count method to real colony count data, interpret a graph of CFU results across water sources, critique an experimental design, and reason about controls and validity in a remote Australian public health context.
1. Interpret colony count data from three water sources
An environmental health officer tested water samples from three sources in a remote community in the Northern Territory. Samples were serially diluted to 10−3 and 0.1 mL was spread per plate. After 48 h incubation at 37°C, three replicate plates were counted per dilution per source. The table below shows colony counts. 8 marks
| Source | Replicate 1 (colonies) | Replicate 2 (colonies) | Replicate 3 (colonies) | Mean |
|---|---|---|---|---|
| Bore water | 41 | 38 | 44 | |
| Rainwater tank | 0 | 0 | 0 | |
| Creek water | 214 | 229 | 198 | |
| Negative control (sterile water) | 0 | 0 | 0 | 0 |
Dilution factor: 10−3; volume plated: 0.1 mL; medium: nutrient agar. Selective medium for E. coli was used in a separate assay (results not shown).
1.1 Calculate the mean colony count for bore water and creek water. Then, using the formula CFU/mL = colony count ÷ (volume plated × dilution factor), calculate the estimated bacterial concentration (CFU/mL) for each. Show all working. 3 marks
1.2 The zero count for the rainwater tank is both a result and a potential source of confusion. Explain two things the zero count does tell you and two things it does not tell you about the safety of the rainwater. 3 marks
1.3 What is the significance of the negative control plate showing zero colonies? What would you conclude if it had shown 5 colonies instead? 2 marks
2. Interpret graph — colony counts vs incubation temperature
A student investigating the effect of incubation temperature on colony count plated 0.1 mL of a 10−3 dilution of bore water onto identical nutrient agar plates and incubated six sets of three replicate plates each at a different temperature for 48 hours. Mean colony counts per plate are plotted below. 7 marks
Figure 2. Mean colony count vs incubation temperature. Bore water; dilution 10−3; volume plated 0.1 mL; nutrient agar; 48 h incubation. Data illustrative of the temperature-growth relationship documented in standard microbiological practice.
2.1 Describe the trend in mean colony count as incubation temperature increases from 15°C to 45°C. Refer to specific data values. 2 marks
2.2 At which temperature(s) is the colony count within the preferred 30–300 countable range? Estimate the CFU/mL values for those temperatures. 2 marks
2.3 A colleague suggests that 45°C should be used as the standard incubation temperature to speed up colony growth. Use the graph and lesson content to evaluate this suggestion, identifying one advantage and one significant problem. 3 marks
3. Spot the errors — a student's experimental design
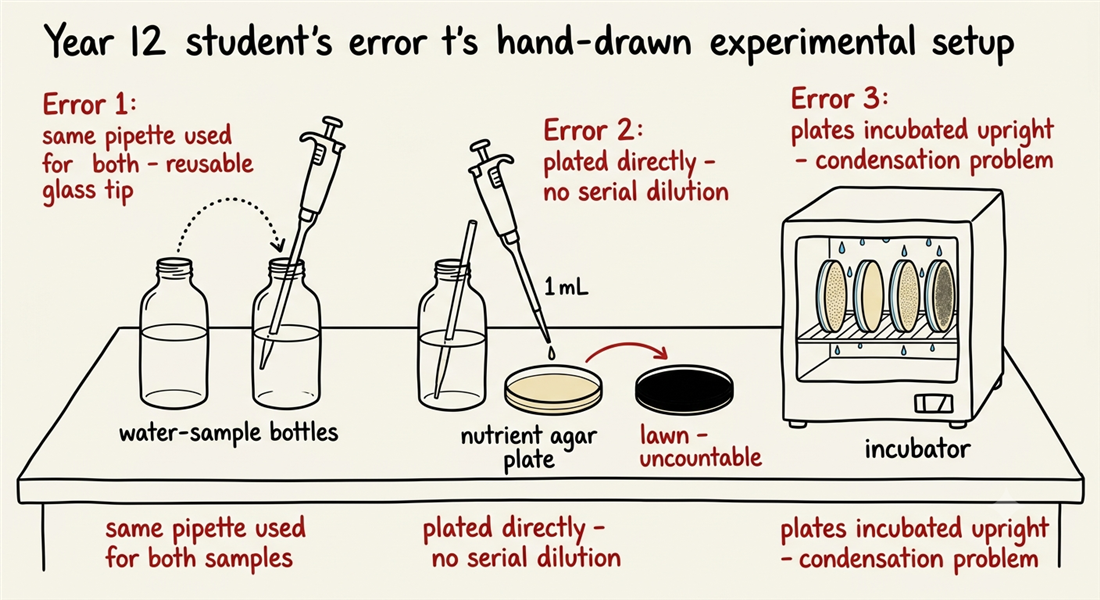
The diagram below represents a student's experimental setup for comparing bacterial counts in tap water and bore water. There are three significant design errors visible. Identify each error, explain why it is a problem, and describe how to correct it. 6 marks (2 per error: 1 identify, 1 correct)
3.1 Error 1: What is wrong?
Correction:
3.2 Error 2: What is wrong?
Correction:
3.3 Error 3: What is wrong?
Correction:
4. Case study — Remote community water testing, Northern Territory
In 2021, the Australian National University reported that up to 40% of remote community water supplies in Australia had detectable E. coli at some point during the study period. In one community, an environmental health officer collected 100 mL water samples from the bore supply at four different times over six weeks and tested each for E. coli using a membrane filtration method. Results are shown below. 7 marks
| Week | E. coli detected (CFU/100 mL) | Australian Drinking Water Guideline: safe? |
|---|---|---|
| 1 | 0 | |
| 2 | 0 | |
| 3 | 4 | |
| 4 | 7 |
4.1 Complete the “safe?” column. State the guideline threshold you used. 1 mark
4.2 Explain why E. coli was used as the test organism here rather than directly testing for Salmonella, Campylobacter, or Cryptosporidium. 2 marks
4.3 The officer collected only one sample per week. Explain how this limits the reliability of the investigation and describe what should be done differently. 2 marks
4.4 The weeks 1–2 results (0 CFU/100 mL) cannot alone confirm the water was fully safe. Identify two types of pathogen that would not be detected by this E. coli culture method, and explain why each escapes detection. 2 marks
Q1.1 — Mean and CFU/mL calculation
Bore water mean: (41 + 38 + 44) ÷ 3 = 41 colonies. CFU/mL = 41 ÷ (0.1 × 10⁻³) = 41 ÷ 0.0001 = 410,000 = 4.1 × 10⁵ CFU/mL.
Creek water mean: (214 + 229 + 198) ÷ 3 = 213.7 ≈ 214 colonies. CFU/mL = 214 ÷ (0.1 × 10⁻³) = 214 ÷ 0.0001 = 2,140,000 = 2.14 × 10⁶ CFU/mL. (1 mark: correct means; 1 mark: correct bore calculation; 1 mark: correct creek calculation with scientific notation.)
Q1.2 — What zero colonies does/does not tell you
Tells you: (1) No bacteria capable of growing on nutrient agar under these specific incubation conditions were present in the volume plated (0 CFU on nutrient agar at 37°C/48 h). (2) The rainwater tank has a lower total viable bacterial count than bore water or creek water under these test conditions.
Does not tell you: (1) Whether viruses (e.g. norovirus, hepatitis A) or protozoa (e.g. Cryptosporidium, Giardia) are present — these cannot be cultured on nutrient agar. (2) Whether E. coli or other faecal pathogens are present — this requires selective media (e.g. MacConkey agar) not nutrient agar. (2 marks for two valid “tells”; 2 marks for two valid “does not tell” — accept any combination totalling 3 marks.)
Q1.3 — Negative control significance
A zero-colony negative control confirms that the agar medium and equipment were sterile and did not introduce bacteria to the plates — it rules out contamination as a source of colonies, validating the experimental results. If it showed 5 colonies, the investigation would be invalid because there would be no way to determine whether any colonies on the sample plates originated from the sample itself or from the contaminated medium/equipment. All results would need to be discarded and the investigation repeated with sterile materials. (1 mark each.)
Q2.1 — Temperature trend description
Mean colony count rises steadily from a very low count (~8 colonies) at 15°C to a broad peak of approximately 122 colonies at 35°C, with only a slight decline at 37°C (~118). Above 37°C, counts fall sharply, reaching approximately 74 at 40°C and near-zero (~9) at 45°C. (1 mark: describes rise to a peak; 1 mark: identifies sharp drop above 37–40°C with specific values.)
Q2.2 — Temperatures within countable range
The 30–300 countable range is satisfied between approximately 25°C and 40°C inclusive. At 30°C (~95 colonies): CFU/mL = 95 ÷ 0.0001 = 9.5 × 10⁵. At 35°C (~122 colonies): CFU/mL = 1.22 × 10⁶. At 37°C (~118 colonies): CFU/mL = 1.18 × 10⁶. (1 mark: correctly identifies multiple temperatures; 1 mark: provides a correct CFU/mL calculation for at least one.)
Q2.3 — Evaluate 45°C suggestion
Potential advantage: Faster colony growth — higher temperature could theoretically produce visible colonies in less than 48 hours if any thermophilic bacteria are present.
Significant problem (and it outweighs any advantage): At 45°C the mean colony count collapses to approximately 9 — well below the 30-colony minimum for a reliable count. This is because most bacteria in environmental water samples are mesophiles (optimal 25–40°C); high temperatures inhibit or kill them, producing a gross underestimate of the true bacterial concentration. The result would be neither accurate nor valid. Temperature must be a controlled variable held within the 25–37°C range for meaningful results. (1 mark: identifies any advantage; 2 marks: explains that 45°C produces a below-30-colony count, gives a reason linked to bacterial growth optimum, and links to accuracy/validity.)
Q3 — Diagram critique
3.1 Error 1 (same pipette reused between samples): Cross-contamination — bacteria from one water source are transferred into the other sample, inflating the count of the lower-bacteria sample and undermining validity. Correction: use a separate sterile pipette/loop for each sample, or ensure the transfer instrument is sterilised between uses.
3.2 Error 2 (no serial dilution — plated directly): Directly plating undiluted water means any heavily contaminated sample will produce confluent (lawn) growth in which individual colonies cannot be distinguished and counted. Correction: perform serial dilution (1 mL into 9 mL sterile water, repeated to 10−3 or 10−4) before plating 0.1 mL from an appropriate dilution onto agar.
3.3 Error 3 (plates incubated upright): Upright incubation causes condensation to form on the inner surface of the lid and drip back down onto the colonies, spreading them and merging separate colonies into one — leading to undercounting and inaccuracy. Correction: invert all plates (agar-side up) before placing them in the incubator. (1 mark identify + 1 mark correction per error.)
Q4.1 — Safe/unsafe column
Week 1: 0 CFU/100 mL — Safe. Week 2: 0 CFU/100 mL — Safe. Week 3: 4 CFU/100 mL — Unsafe. Week 4: 7 CFU/100 mL — Unsafe. Threshold used: fewer than 1 CFU of E. coli per 100 mL (Australian Drinking Water Guidelines). (1 mark for all rows correctly labelled and guideline stated.)
Q4.2 — Why E. coli as indicator
E. coli is used as an indicator because (1) its presence reliably signals faecal contamination, meaning other faecal pathogens (Salmonella, Campylobacter, Cryptosporidium) are likely present — it is a practical proxy for the full spectrum of faecal risk; and (2) it is easy and quick to culture on selective media, inexpensive, and straightforward to count. Testing directly for every possible pathogen individually would be prohibitively time-consuming and expensive for routine monitoring. (2 marks: 1 for indicator/proxy rationale; 1 for practical/cost-efficiency reason.)
Q4.3 — Reliability limitation
One sample per week means there is no way to assess within-week variability or detect short-term contamination events (e.g. after rainfall or pipe disturbance). A single result could be atypically high or low due to random variation. Reliability requires multiple replicate samples per time point and/or more frequent testing — at minimum, three samples per collection event should be tested to allow averaging and detection of outliers. (1 mark: identifies lack of replication as the limitation with a validity/reliability link; 1 mark: describes a specific improvement.)
Q4.4 — Pathogens not detected by E. coli culture
Accept any two of the following: (1) Viruses (e.g. norovirus, hepatitis A) — viruses cannot grow on nutrient agar because they require living host cells to replicate; they would produce zero colonies regardless of their concentration in the water. (2) Protozoa (e.g. Cryptosporidium parvum, Giardia lamblia) — these are protists, not bacteria; they require a completely different detection method (immunofluorescence microscopy or PCR) and cannot be grown on nutrient agar. (3) Bacteria requiring special media (e.g. Campylobacter) — certain pathogenic bacteria require microaerophilic conditions or specialised selective media not used here; they would not grow under standard nutrient-agar incubation conditions. (1 mark per pathogen type with correct explanation; max 2 marks.)