Biology • Year 11 • Module 4 • Lesson 1
Introduction to Ecosystems
Apply your understanding of ecosystem components, trophic roles, and abiotic factors to real data, new scenarios, and a diagram critique.
1. Interpret field-survey data from a wetland ecosystem
A field ecologist surveyed an Australian coastal wetland and recorded the following measurements for five sampling plots. Each plot covers 100 m². 8 marks
| Plot | Water temp (°C) | Dissolved O⊂2; (mg/L) | Phytoplankton density (cells/mL × 103) | Zooplankton abundance (ind./L) | Small fish abundance (per plot) |
|---|---|---|---|---|---|
| 1 | 18 | 9.2 | 42 | 380 | 24 |
| 2 | 22 | 8.1 | 68 | 610 | 41 |
| 3 | 26 | 7.0 | 95 | 840 | 57 |
| 4 | 30 | 5.8 | 78 | 720 | 48 |
| 5 | 34 | 4.2 | 31 | 290 | 18 |
1.1 Identify whether water temperature and dissolved oxygen are biotic or abiotic factors. Explain your reasoning. 2 marks
1.2 Describe the trend in phytoplankton density as temperature increases from Plot 1 to Plot 5. Identify the temperature at which phytoplankton density peaks and suggest one reason for the decline in density at Plot 5. 3 marks
1.3 Using the data, explain the relationship between phytoplankton, zooplankton and small fish in terms of trophic roles. What does the parallel trend in all three groups suggest about how energy moves through this ecosystem? 3 marks
2. Interpret a graph — effect of ocean temperature on coral reef productivity
The figure below shows a stylised model of coral reef primary productivity (organic carbon fixed per m² per year by zooxanthellae and other primary producers) plotted against mean annual sea surface temperature. 7 marks
Stylised model of reef productivity — illustrative of Card 4 abiotic factor principles (temperature, bleaching threshold). Values approximate published estimates.
2.1 Identify the temperature at which primary productivity peaks. Estimate the productivity value at this peak. 2 marks
2.2 Using your knowledge of biotic and abiotic components, explain why primary productivity declines sharply above 30°C. Name the abiotic factor responsible and describe its biological effect. 3 marks
2.3 Using the graph, predict the likely consequence for secondary consumers (such as reef fish) if the sea surface temperature rose permanently to 33°C. Justify your prediction by tracing the impact through the biotic components. 2 marks
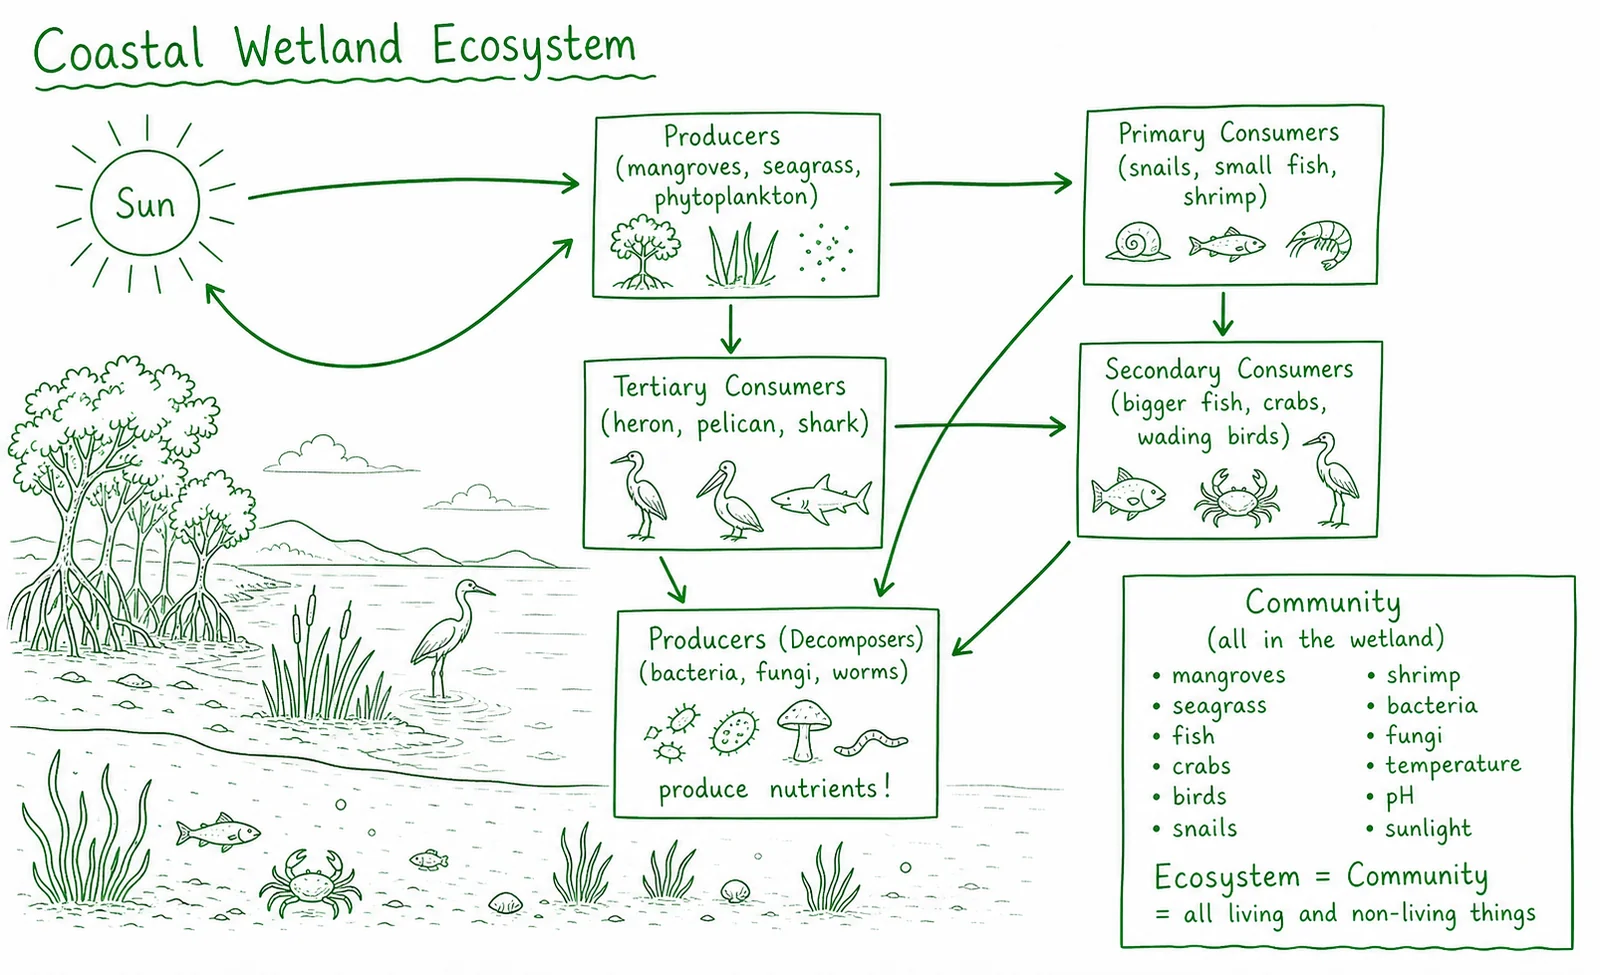
3. Diagram critique — spot the errors in this student’s work
A Year 11 student has drawn a diagram representing a simple ecosystem. There are three biological errors. Identify each error and write the correction. 6 marks (2 per error: 1 identify, 1 correct)
3.1 Error 1: What is wrong?
Correction:
3.2 Error 2: What is wrong?
Correction:
3.3 Error 3: What is wrong?
Correction:
4. Predict and justify — removing decomposers from a forest
Imagine all decomposers (bacteria and fungi) were suddenly removed from an Australian temperate rainforest. Every other organism — trees, insects, birds, mammals — remained unaffected initially. 4 marks
4.1 Predict two changes that would occur in the forest ecosystem within five years. For each change, write a justification that explicitly connects it to the role of decomposers in the ecosystem. 4 marks (2 per prediction + justification)
Q1.1 — Biotic vs abiotic (2 marks)
Water temperature and dissolved oxygen are both abiotic factors [1] because they are non-living physical or chemical components of the ecosystem — temperature is a physical condition and dissolved oxygen is a dissolved inorganic gas. Neither is living or was once living [1].
Q1.2 — Phytoplankton trend (3 marks)
Phytoplankton density increases from Plot 1 (42 × 103 cells/mL) to a peak at Plot 3 (95 × 103 cells/mL, 26°C) [1], then declines as temperature increases to Plots 4 and 5 [1]. The peak is at approximately 26°C. The decline at Plot 5 (34°C) could result from high temperatures denaturing the enzymes needed for photosynthesis (e.g. rubisco) or from reduced dissolved oxygen availability at high temperatures, inhibiting aerobic processes [1].
Q1.3 — Trophic roles and energy flow (3 marks)
Phytoplankton are producers (photoautotrophs) — they use sunlight to fix carbon into organic compounds. Zooplankton are primary consumers (herbivores) that feed on phytoplankton. Small fish are secondary consumers (carnivores) that feed on zooplankton [1]. The parallel trend in all three groups (peaking at around 26°C and declining at extreme temperatures) [1] suggests that energy is transferred from one trophic level to the next — when the producer population declines, primary consumers lose their food source and also decline, and this cascades up to secondary consumers. This illustrates that energy enters through producers and flows one-way up the trophic levels [1].
Q2.1 — Peak productivity (2 marks)
Primary productivity peaks at approximately 26°C [1], with an estimated productivity of approximately 2400–2500 g C m² yr&supmin;¹ (accept 2200–2600 from the graph) [1].
Q2.2 — Decline above 30°C (3 marks)
The abiotic factor responsible is temperature [1]. Above approximately 30°C, the thermal stress causes coral polyps to expel their zooxanthellae (symbiotic algae) in a process known as coral bleaching [1]. Because zooxanthellae are the primary photoautotrophs (producers) on the reef, providing up to 90% of the coral’s energy via photosynthesis, losing them dramatically reduces primary productivity. High temperatures also denature photosynthetic enzymes, directly reducing the rate of carbon fixation [1].
Q2.3 — Effect on secondary consumers at 33°C (2 marks)
At 33°C (well above the bleaching threshold), primary productivity approaches zero, meaning producers (zooxanthellae, algae) are nearly eliminated [1]. Without producers, primary consumers (herbivorous fish, zooplankton) lose their food source and their populations decline; as primary consumers decline, secondary consumers (reef fish that eat herbivorous fish) also lose their food source and their populations will decline, possibly to local extinction. This cascade illustrates how removing the energy base from the bottom of the trophic structure ripples through all higher levels [1].
Q3 — Diagram critique (6 marks)
3.1 Error 1 (energy recycled back to sun): Energy does not cycle back to the sun — it flows one-way through the ecosystem. Correction: Energy arrows should flow sun → producers → consumers, with heat lost at every step via cellular respiration. There is no return arrow back to the sun [1 + 1].
3.2 Error 2 (decomposers labelled “producers”): Decomposers are not producers. Producers synthesise organic compounds from inorganic sources using an external energy input (light or chemicals). Decomposers are heterotrophs — they obtain energy by breaking down dead organic matter. Correction: Decomposers should be labelled as “decomposers” or “saprotrophs” and placed in the detrital pathway, not the producer position [1 + 1].
3.3 Error 3 (community labelled as including abiotic factors): A community is defined as all populations of different species in an area — it includes only biotic components. Including temperature and pH in the community box, and equating community with ecosystem, is incorrect. Correction: A community includes only biotic organisms; an ecosystem = community + abiotic environment. The label should distinguish the two: the community box holds only organisms, and a separate region includes abiotic factors; together these form the ecosystem [1 + 1].
Q4.1 — Predictions for decomposer removal (4 marks)
Prediction 1: Dead organic matter (leaf litter, fallen logs, dead animal bodies) would accumulate on the forest floor [1]. Justification: Decomposers are responsible for breaking down dead organic matter via extracellular digestion. Without them, the detrital pathway is blocked; dead biomass cannot be broken down into inorganic nutrients and will pile up [1].
Prediction 2: Mineral nutrient availability in the soil would decline sharply, causing producers (trees, shrubs, mosses) to become nutrient-limited and eventually die [1]. Justification: Decomposers release inorganic nutrients (nitrates, phosphates) back into the soil as they break down dead matter — this is how matter is cycled. Without decomposers, nutrients remain locked in dead biomass and cannot be absorbed by roots; plant growth declines because essential elements are unavailable [1].